Making Quick Pivot Tables off your SQL results
You've crafted your SQL to return data exactly in the format you want. The next step is to present an analysis on the data. You could export the data as a CSV to create formulas in a spreadsheet – but, organizing and arranging data to show a summary would take hours and is error-prone. This is why we have pivot tables built into Silota.
A pivot table is a special type of summary table that’s unique to spreadsheets like Excel. Pivot tables are great for summarizing values in a table because they do their magic without making you create formulas to perform calculations. Pivot tables let you play around with the organization and arrangement of the summarized data. It’s this capability of changing the arrangement of summarized data on the fly by simply rotating row and column headings that give pivot tables its name.
Key components of a pivot table
Given a database table with the following schema:
create table adwords_keyword_performance (
    date_d date,
    keyword varchar(32),
    impressions integer,
    clicks integer,
    conversions integer
)
A simple select statement to get your total performance for a day:
select
    date_d, sum(impressions), sum(clicks), sum(conversions)
from adwords_keyword_performance
group by 1
order by 1
You might have questions about your data, for example:
- keywords with the most impressions
- days with the most impressions
- total impressions for a day
All of these questions can be answered by a pivot table.
Your first pivot table
If you want to create a table for the sum of impressions by keyword, a pivot on the keyword column will generate the following table:
| date_d | keyword_1 | keyword_2 | keyword_3 |
|---|---|---|---|
| 2016-01-01 | 15 | 19 | |
| 2016-01-01 | 21 | 13 | 8 |
| 2016-01-01 | 25 | 15 |
This table is a lot easier to consume and visualize.
Pivot tables in Silota
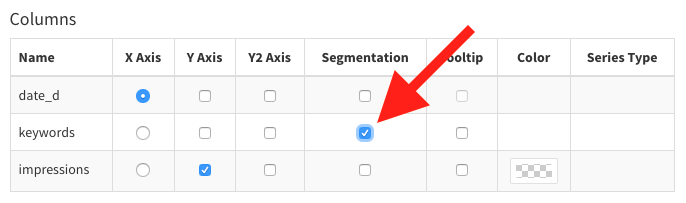
Once your query is ready, head over to the 'Series' and simply pick the columns you want to pivot on.
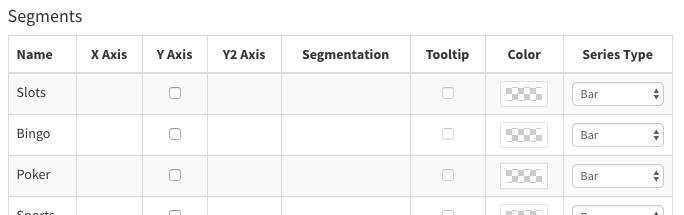
Once you've picked a column to pivot on "segment", you are free to customize any of the generated segments. You can change chart types, change colors assigned or hide them completely.
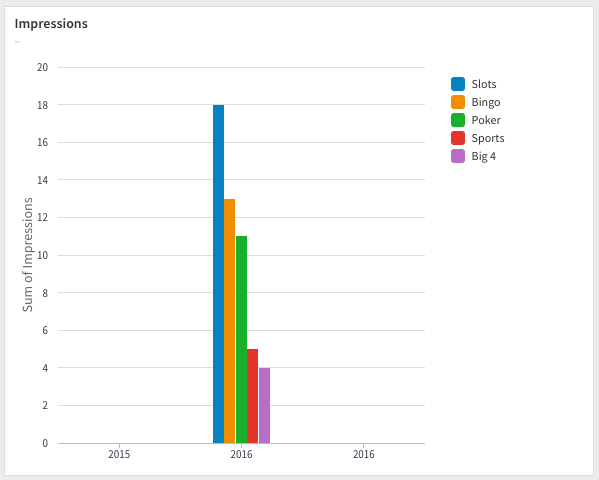
Your resulting chart:
Can you do this in regular SQL?
Yes, but your queries will be messy:
select
    date_d,
    sum(case when keyword = 'keyword_1' then impressions else 0 end) as keyword_1,
    sum(case when keyword = 'keyword_2' then impressions else 0 end) as keyword_2,
    sum(case when keyword = 'keyword_3' then impressions else 0 end) as keyword_3
from adwords_keyword_performance
group by 1
order by 1
You'll be tasked with keeping this query updated as you add new keywords.
References:
 Onboarding forward-thinking teams now:
No spam, ever! Unsubscribe any time. Learn more about the product.