Calculating Summary Statistics in SQL
When you first get your hands on a data set, what's it like:
- quickly get a feel for the data?
- are there outliers?
- is the data shaped abnormally?
These are questions you might have about your data. The disadvantage of a spreadsheet-like interface is that it's difficult to understand your data, speically when you're seeing one for the first time.
For this purpose, we have summary statistics. Fortunately, SQL has a robust set of functions to do exactly that.
As an example, we'll use a list of the fastest growing companies in the United States according to Inc. magazine. The data table is formatted as:
| Name | State | Industry | Employees | Revenue |
|---|---|---|---|---|
| Fuhu | California | Consumer Products & Services | 227 | 195640000 |
| Quest Nutrition | California | Food & Beverage | 191 | 82640563 |
| Reliant Asset Management | Virginia | Business Products & Services | 145 | 85076502 |
| Superfish | California | Software | 62 | 35293000 |
| Acacia Communications | Massachusetts | Telecommunications | 92 | 77652360 |
| Provider Power | Maine | Energy | 50 | 137977203 |
| Crescendo Bioscience | California | Health | 129 | 27308000 |
| Plexus Worldwide | Arizona | Health | 130 | 159897088 |
| Vacasa | Oregon | Travel & Hospitality | 264 | 26263454 |
| Go Energies | North Carolina | Energy | 11 | 32851754 |
| Minute Key | Colorado | Consumer Products & Services | 113 | 15782039 |
| Sainstore | Kansas | Business Products & Services | 135 | 19243863 |
| The HCI Group | Florida | Health | 153 | 34583142 |
| Dynamic Dental Partners Group | Florida | Health | 313 | 19802935 |
| ... | ... | ... | ... | ... |
Inspired by Spreadsheets
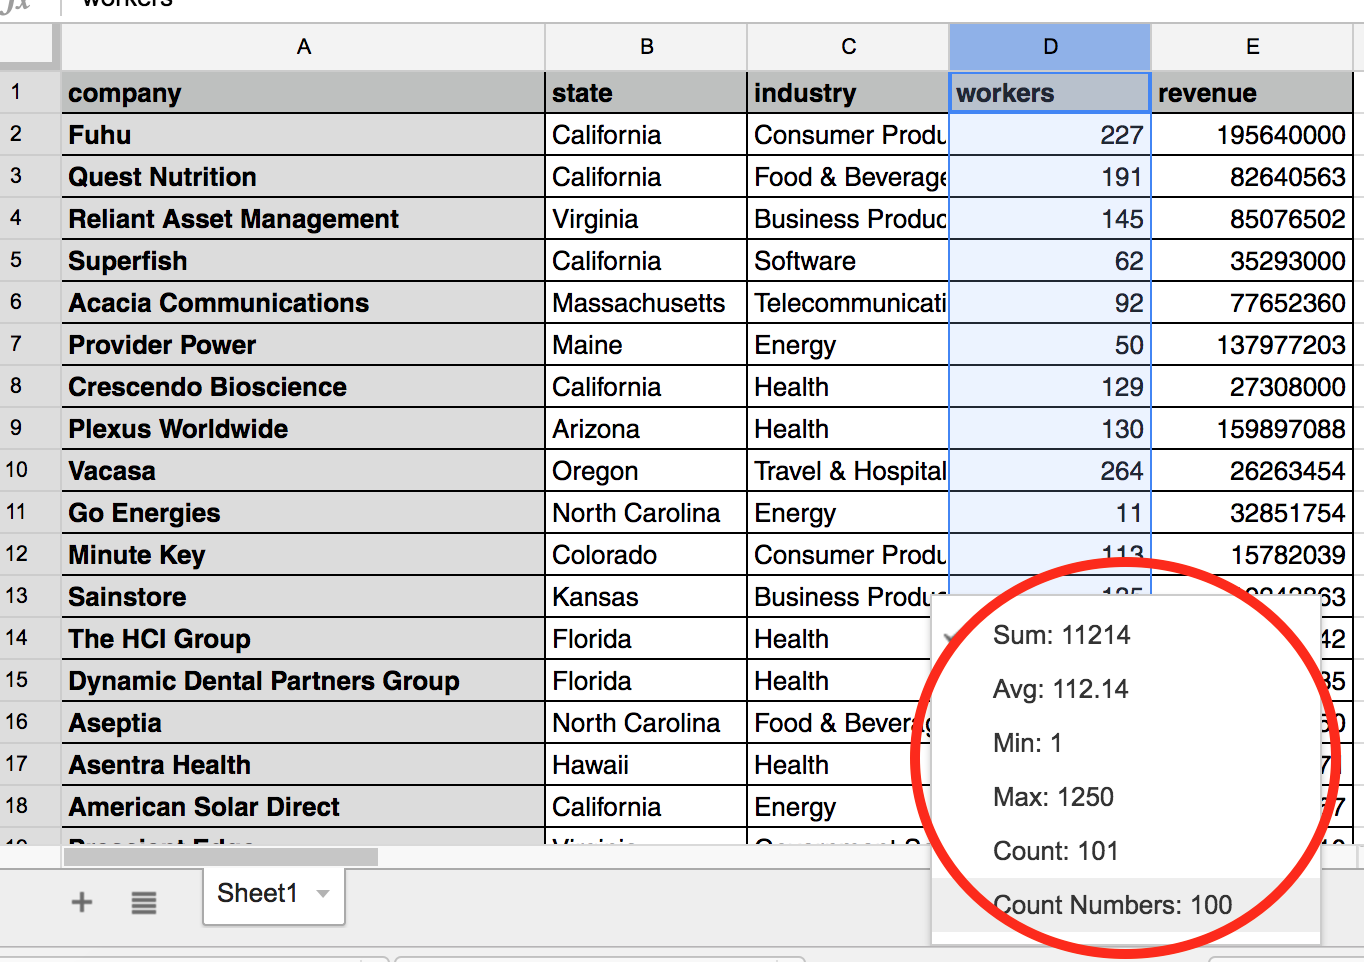
Our inspiration comes from spreadsheet applications like Microsoft Excel or Google Sheets that show you a summary of a column in the footer:
Understanding the Data
For the purposes of this example, we are only interested in the distribution of the numerical columns:
- employees
- revenue
We will calculate the mean and measure the level of variability (min and max) of the data. These are often a good start.
select 'total',
    sum(employees) as employees,
    sum(revenue) as revenue
from inc5000
union
select 'average',
    avg(employees),
    avg(revenue)
from inc5000
union
select 'min',
    min(employees),
    min(revenue)
from inc5000
union
select 'max',
    max(employees),
    max(revenue)
from inc5000
Will give us a result like this:
| ?column? | employees | revenue |
|---|---|---|
| Total | 65301 | 15088861318 |
| Avg | 96.45642540620383 | 22320800.76627219 |
| Max | 5603 | 985737000 |
| Min | 0 | 1953000 |
This is cool, but let's append it to the main table above so that we have everything to look at in one place.
select name, employees, revenue
from inc5000
union
select 'total',
    sum(employees) as employees,
    sum(revenue) as revenue
from inc5000
union
select 'average',
    avg(employees),
    avg(revenue)
from inc5000
union
select 'min',
    min(employees),
    min(revenue)
from inc5000
union
select 'max',
    max(employees),
    max(revenue)
from inc5000
Unfortunately, it seems like the summary statistics are lost within the rows of the main table. We should bring up to the top so that it's easy to glance at. This is possible by artifically creating a column with the row index we want and sorting by them.
select *
from
    ( select 5,
            company,
            employees,
            revenue
    from inc5000
    union select 1,
                'total',
                sum(employees) as employees,
                                sum(revenue) as revenue
    from inc5000
    union select 2,
                'avg',
                avg(employees),
                avg(revenue)
    from inc5000
    union select 3,
                'min',
                min(employees),
                min(revenue)
    from inc5000
    union select 4,
                'max',
                max(employees),
                max(revenue)
    from inc5000) stats
order by 1
Final Result
| ?column? | company | employees | revenue |
|---|---|---|---|
| 1 | Total | 65301 | 15088861318 |
| 2 | Avg | 96.45642540620383 | 22320800.76627219 |
| 3 | Min | 0 | 1953000 |
| 4 | Max | 5603 | 985737000 |
| 5 | Transactis | 61 | 5485216 |
| 5 | Bareburger | 268 | 31150000 |
| 5 | SmartZip Analytics | 96 | 11396150 |
| 5 | FastPay | 26 | 5061986 |
| 5 | Trend Nation | 38 | 12149714 |
| 5 | InterRail | 11 | 17114363 |
| 5 | JayBird | 95 | 31216712 |
| 5 | Softhq | 188 | 16058111 |
| ... | ... | ... | ... |
More summary statistics
The SQL in this post are fairly simple using built-in functions. We'll cover more advanced summary statistics in other sections:
- medians
- variances, standard deviations and z-scores
- correlations
- linear regression line
No spam, ever! Unsubscribe any time. See past emails here.