Calculating Linear Regression Coefficients in SQL
Regression is an incredibly powerful statistical tool, when used correctly, has the ability to help you predict the future. One could argue that hypothesis testing and prediction together are the pillars of data analysis.
The basic regression analysis uses fairly simple formulas to get a "best fit" line through your data. We are going to be specifically looking at simple regression analysis.
Businesses love regression analysis because it gives you powerful tools to:
- forecast next year's revenue
- predict site visitors given past historical and seasonal trends
- generate a risk score given demographics.
The math
A regression line is simply a line

that is able to compute an output variable  for an input variable
  . A line can be described by two parameters, also called coefficients:
- the slope

- the intercept

The coefficients and are computed via two equations, which you can find in any textbook on statistical analysis:


where  and
and  are the averages for and .
That's it!
The SQL
Since SQL does not have regression functions as built-ins, we are going to manually input the equations.
We are going to take an iterative procedure to constructing the coefficients and . Let's assume we have a data in a table named ols with the columns, x and y. We first visualize the data using a scatter plot, the most common way to visually inspect the relationship between the data points:
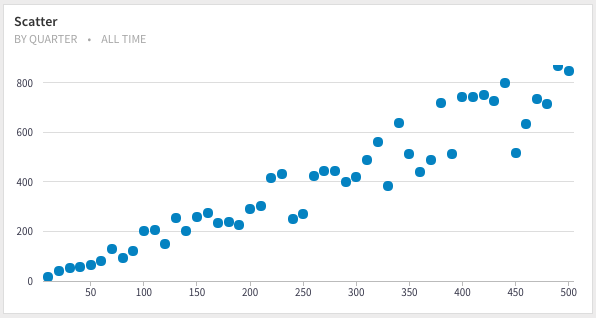
We are able to see a fairly linear relationship between and .
We can compute the averages and for all the rows in the table:
select avg(x) as x_bar,
       avg(y) as y_bar
from ols;
| x_bar | y_bar |
|---|---|
| 255 | 395.671 |
By using window functions, we can repeat the averages and row by row. This is to calculate the term  .
.
select x, avg(x) over () as x_bar,
       y, avg(y) over () as y_bar
from ols;
and then,
select sum((x - x_bar) * (y - y_bar)) / sum((x - x_bar) * (x - x_bar)) as slope
from (
    select x, avg(x) over () as x_bar,
           y, avg(y) over () as y_bar
    from ols) s;
| slope |
|---|
| 1.5930700120048 |
To calculate the intercept, we wrap the above query in another subquery and reuse the calculation:
select slope,
       y_bar_max - x_bar_max * slope as intercept
from (
    select sum((x - x_bar) * (y - y_bar)) / sum((x - x_bar) * (x - x_bar)) as slope,
           max(x_bar) as x_bar_max,
           max(y_bar) as y_bar_max
    from (
        select x, avg(x) over () as x_bar,
               y, avg(y) over () as y_bar
        from ols) s;
)
which gives you,
| slope | intercept |
|---|---|
| 1.5930700120048 | -10.5618530612244 |
Hence, our best fit regression line has the equation:

Visualizing the Regression line
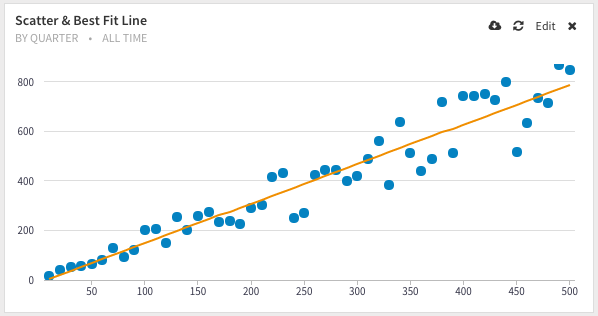
For the purposes of visualizing the best fit regression line, we use the coefficients previously computed (alternatively, you can compute these coefficients on the fly):
select x, y, 1.5930700120048 * x - 10.5618530612244 as y_fit from (
    select x, y from ols
) s
No spam, ever! Unsubscribe any time. See past emails here.