Geomap Charts
Overview
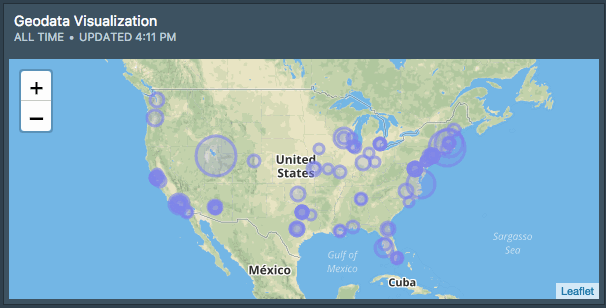
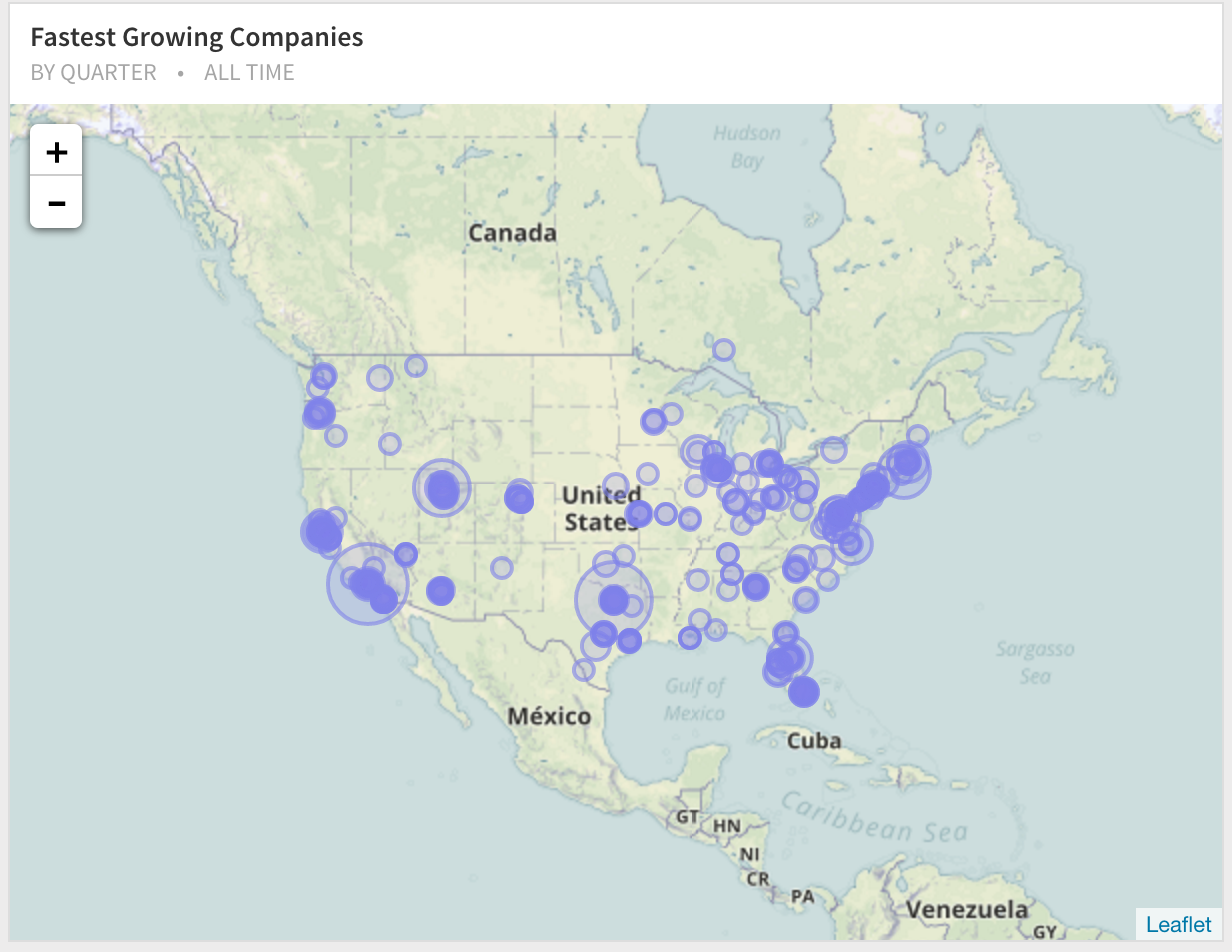
Geomap charts can be thought of a scatter plot with the X-Y coordinates being the latitude and longitude. The background of a geomap can be either a continent, country or a region (eg: district or city.)
There are a variety of ways to visualize geographical data, the simplest being a point at each coordinate. The other options are:
Data format
| Latitude | Longitude | Weight |
|---|---|---|
| lat_1 | lon_1 | w_1 |
| lat_2 | lon_2 | w_2 |
| lat_3 | lon_3 | w_3 |
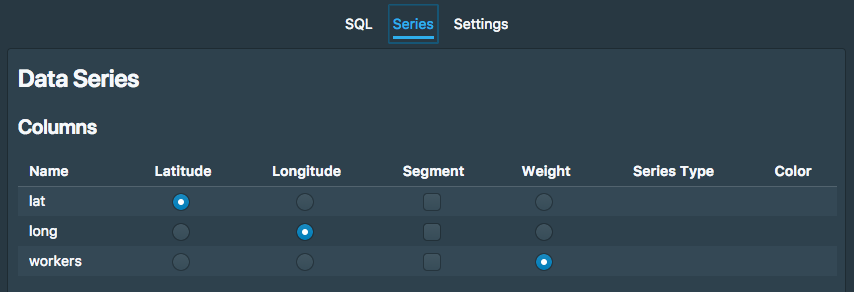
Picking what to plot
Once you've run your query, go over to the "Series" tab to pick the latitude, longitude and the weight columns. The weight columns are used in bubble and heatmap geomap charts as the radius.
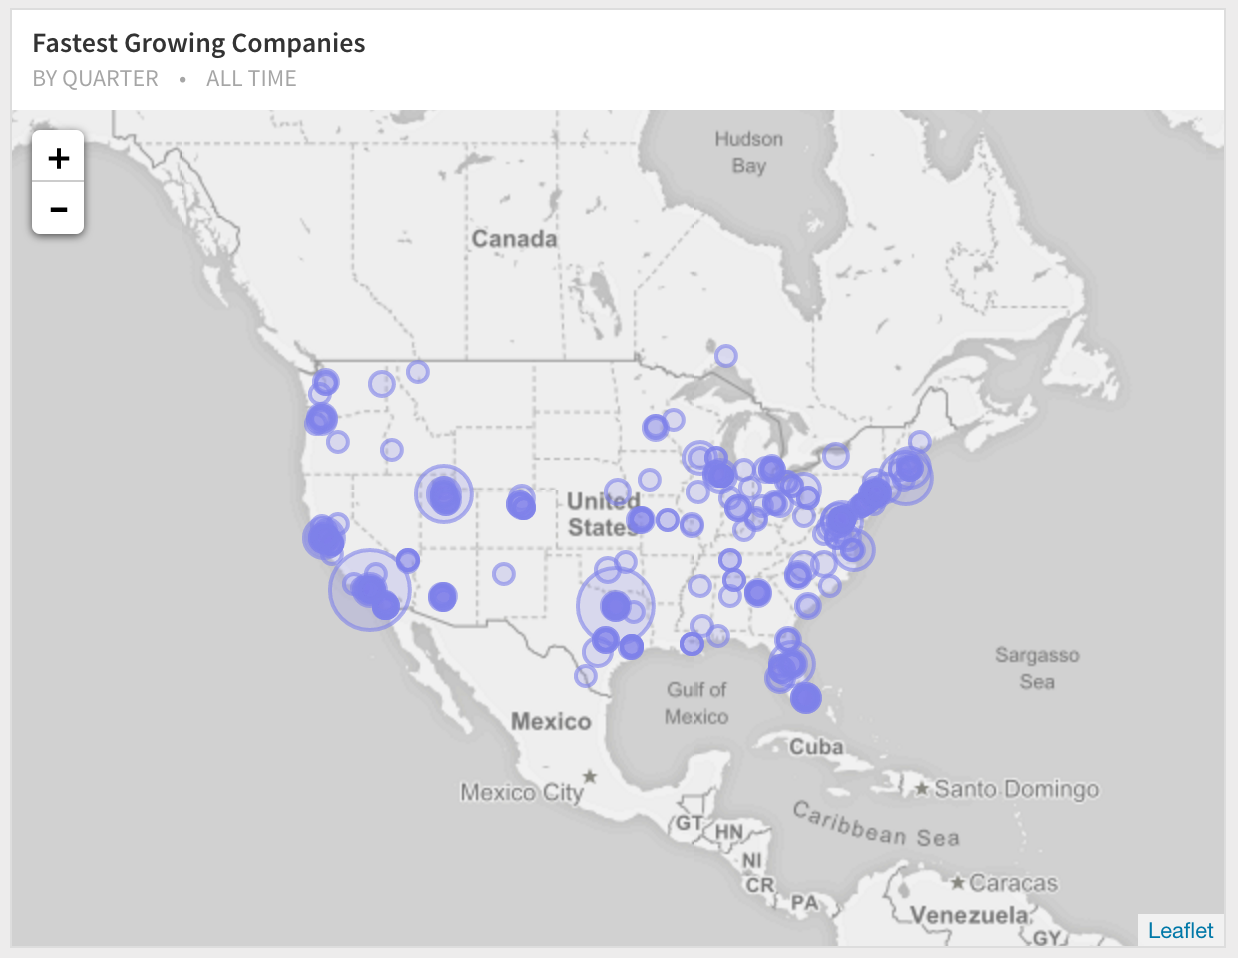
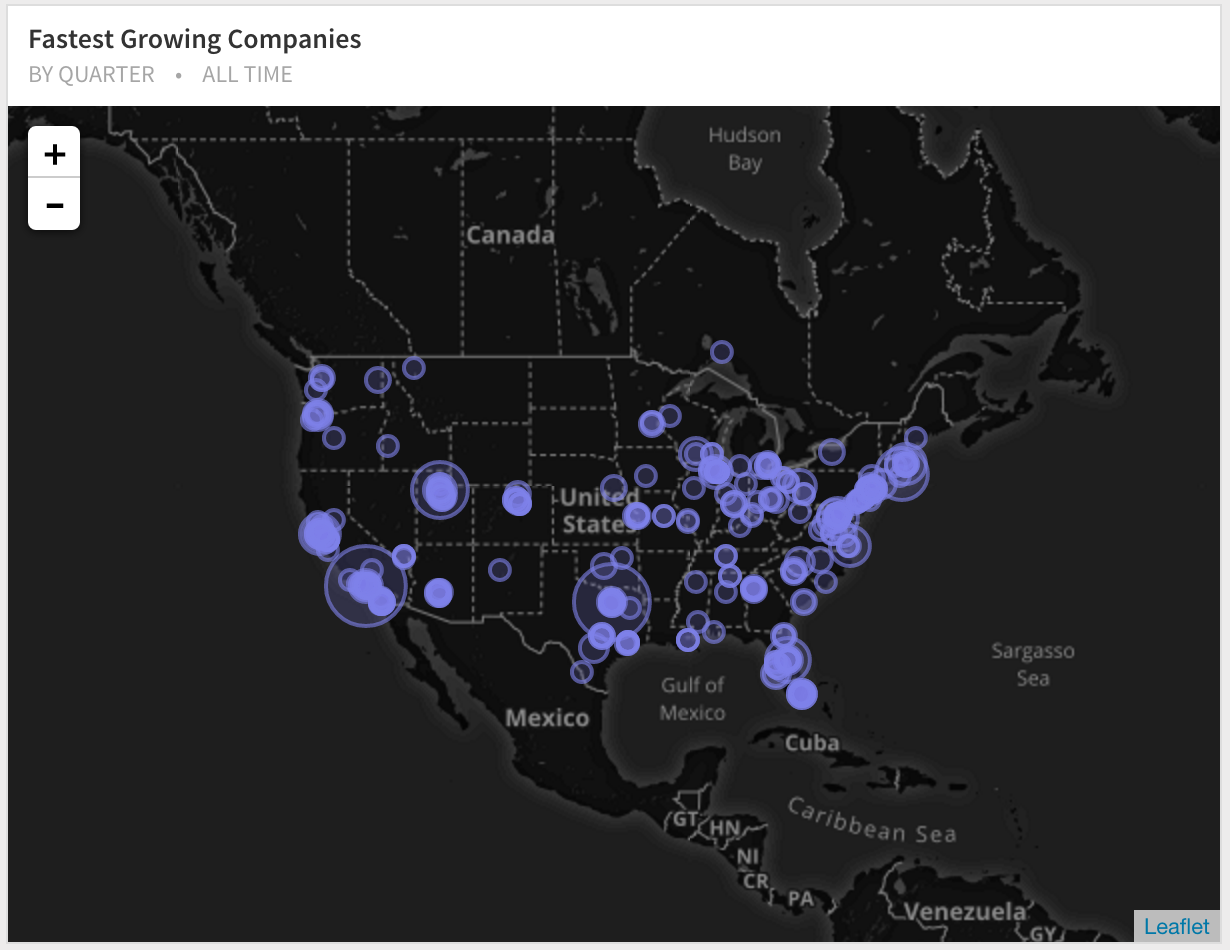
Configuration
Besides the visualization styles of points, bubbles, clusters and heatmaps – you can also configure the basemap use to display the background. The default is called "Streets", but you can also use one of "Light", "Dark" and "Outdoor".
 Onboarding forward-thinking teams now:
No spam, ever! Unsubscribe any time. Learn more about the product.