Scatter & Bubble charts
Overview
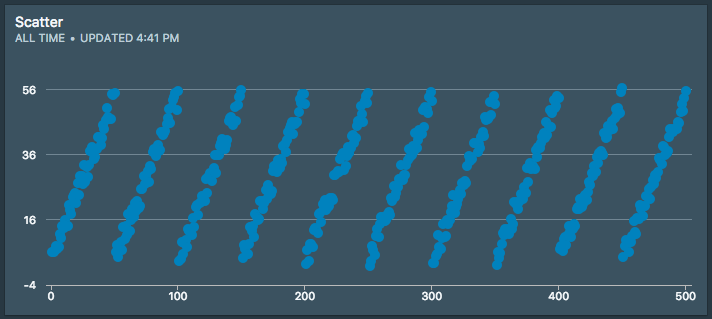
Scatter and Bubble charts display a relationship between two series of data. Also called an XY chart.
Data format
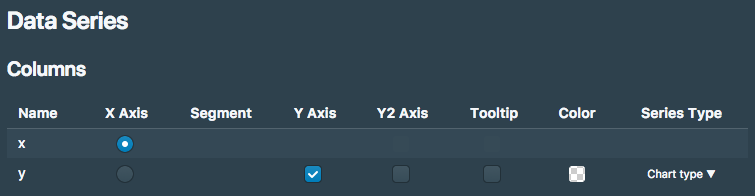
Scatter and Bubble charts allow you to chart two, three or four different variables:
- 2 variables: just x and y values
- 3 variables: x, y values additionally color coded by "segment" column
- 4 variables: x, y values, segment and weight "Z axis"
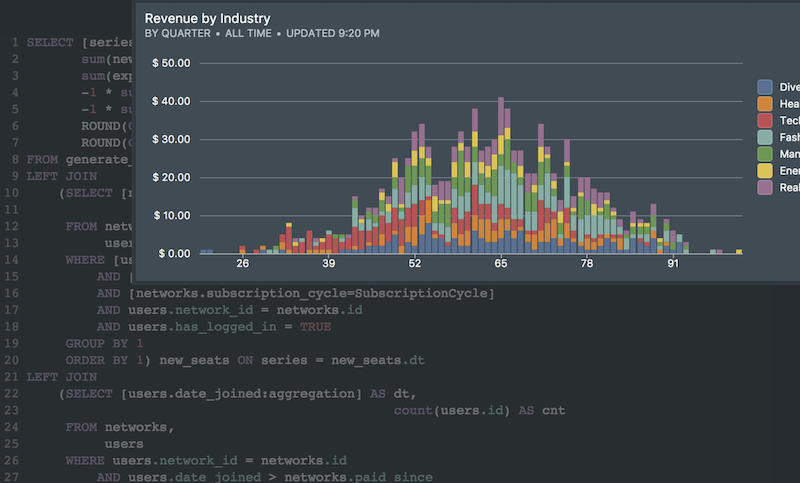
Next Generation SQL Data Analysis
Write SQL, visualize data, and share your results.
 Onboarding forward-thinking teams now:
Onboarding forward-thinking teams now:
No spam, ever! Unsubscribe any time. Learn more about the product.