Geomap Bubbles & Clusters
The Bubble and Cluster geomap charts are used when you have too many points and want to group them together. Bubble geomaps will group points into overlapping bubbles whose radius is proportional to the number of points contained. If you additionally include a weight column, the radius is a weighted sum of the points contained.
Clusters will group points together and show a count of the number of points. Depending on the zoom level, the cluster will disperse into the individual points.
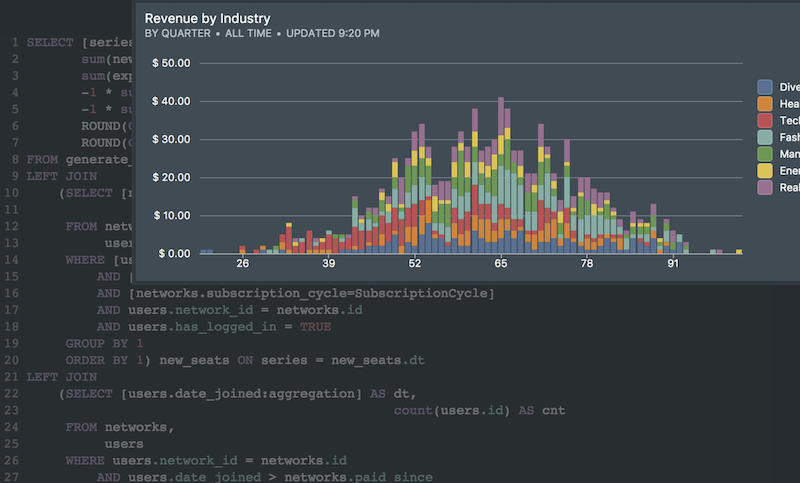
Next Generation SQL Data Analysis
Write SQL, visualize data, and share your results.
 Onboarding forward-thinking teams now:
Onboarding forward-thinking teams now:
No spam, ever! Unsubscribe any time. Learn more about the product.