Using SQL to analyze Bitcoin, Ethereum & Cryptocurrency Performance
Cryptocurrency like Bitcoins, Ethererum and a hundred other currencies are probably the most exciting tech to appear on the scene after the Internet – some pundits even say cryptocoins maybe the TCP/IP of money. It remains to be seen how the tech evolves, but meanwhile we can do some basic technical analysis on what's fuelling the growth and to see if it's sustainable.
In this recipe, we'll analyze bitcoin, ethereum and other cryptocoin performances using intermediate to advanced SQL:
- Capturing correlations between the different cryptocoins ➡ helps balance/diversify your portfolio
- Exposure of cryptocoins to one specific fiat currency ➡ reduces risk of one foreign currency tanking your investments
- Sustainability of Initial Coin Offerings (ICO) ➡ the modern day gold-rush
- Liquidity of the top cryptocoins ➡ a health marker for the market for cryptocoins
- Possible emergent behavior that's typical of the public markets (window dressing) ➡ identifies cyclical patterns
Disclaimer: The purpose here is to teach SQL and timeseries data analysis, and not be a deep-dive technical post on cryptocoins. And it's most certainly not financial advice. If you find mistakes, please reach out with corrections.
Analysis 1: How correlated are cryptocoins with each other
As an investor, you'll be interested in diversifying your portfolio using a variety of assets – stocks, bonds, cash including foreign currency, real-estate and fine-art if you're into that. If you're looking to further diversify your portfolio using cryptocoins, you'll want to understand if the hundred or so coins are related in any way. Investing in assets that move up or down together exposes your portfolio to undue risk.
We'll look at the top three coins – Bitcoin, Ethereum and Monero and calculate their pair-wise correlations. We've calculated the correlation every quarter – the analysis shows certain quarters are highly correlated. Global events like the SEC rejecting the Bitcoin ETF proposal or the rise / fall of the DAO impacts all cryptocoins resulting in a strong correlation.
Chart 1: Quarterly correlations between Bitcoin, Ethereum and Monero
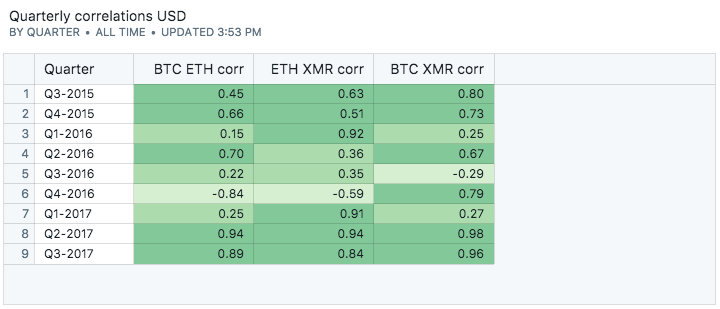
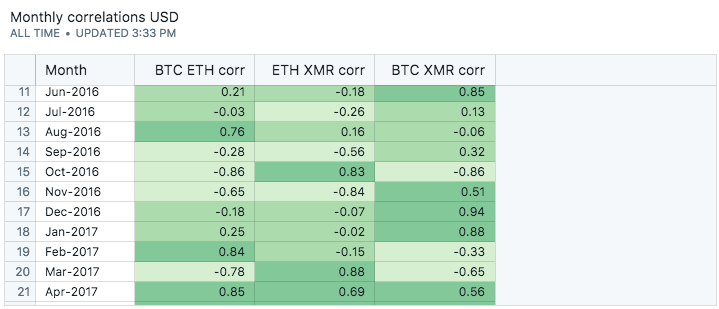
Chart 2: Monthly correlations between Bitcoin, Ethereum and Monero
We zoom into the fourth quarter of 2016, where apparently Ethereum shows a negative correlation with Bitcoin and Monero.
Analysis 2: What's the Japanese exposure to cryptocoin prices
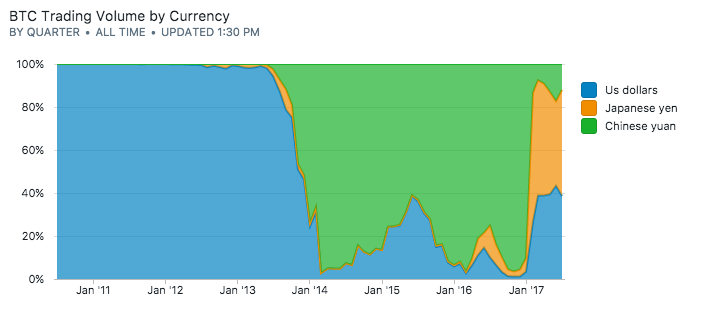
There are hundreds of exchanges around the world where you can trade real-world money like US Dollars and Japanese Yen in exchange for cryptocoins. Charting the cryptocoin exchange volumes across different currencies, we see really interesting patterns. We've made the chart a proportional chart (a chart that adds upto 100% because trading volumes are growing over time and absolute numbers will mask this pattern.)
Until the end of 2013, the US dollar dominated the exchanges, but for the next three years, the Chinese Yuan dominates. Early on in 2017, the Japanese Yen picks up as a dominant currency equal to and sometimes surpassing the US dollar.
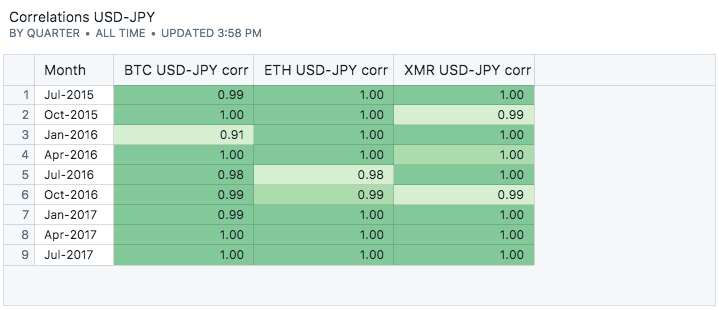
Just for fun, we compute correlations in cryptocoin trading volumes in Japanese Yen and US dollars across Bitcoin, Ethereum and Monero. As expected, it's mostly positive correlations. If there were any arbitrage opportunities, it's not visible in the data granuarity available to us.
Analysis 3: Are Initial Coin Offerings sustainable?
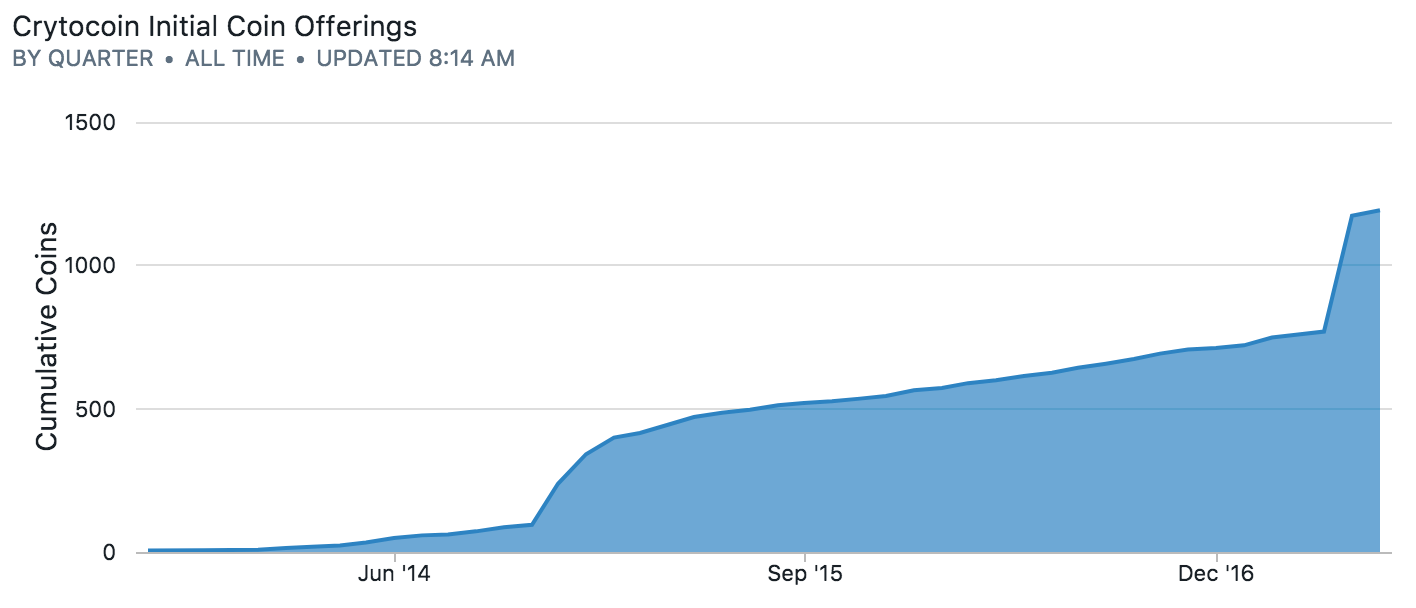
There's an Initial Coin Offering (ICO) almost every day and the data is too noisy to understand anything. There are now well over a thousand cryptocoins available for trade. Soliciting analysis ideas.
A comparison with the years 1999-2000 Internet stock bubble would be a good comparison. We know how that story ends – will ICOs have the same fate?
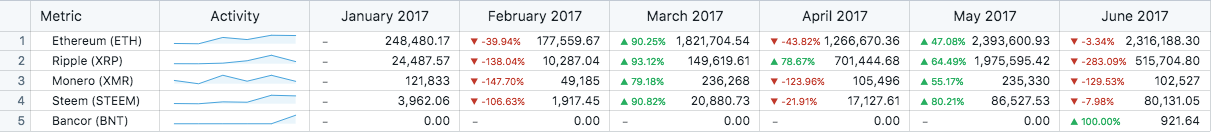
Analysis 4: How liquid are cryptocoins
I equate liquidity of a security / financial instrument as a proxy for the health of the underlying instrument. Tell me if I'm wrong.
Looking at month-over-month growth of trading volume – you see big spikes followed by big drops. The market for cryptocoins still has liquidity issues and in our humble opinion, still unstable.
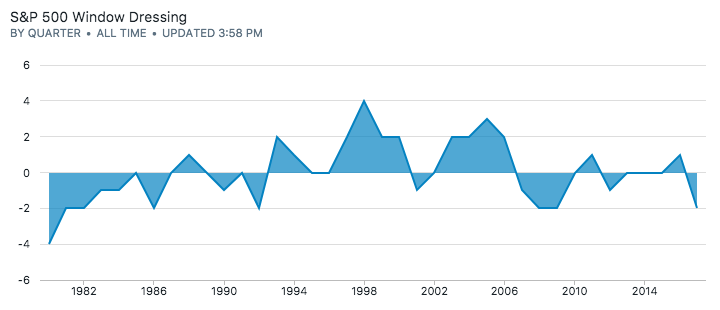
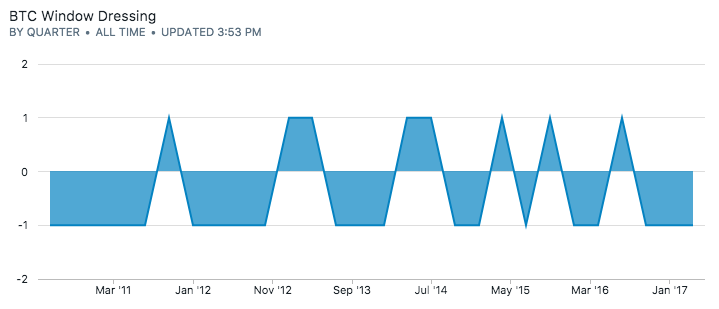
Analysis 5: Do cryptocoins exhibit end-of-quarter volume volatility (window dressing)
Traditional assets classes like mutual funds show anomalous end-of-quarter effects while fund managers sell / buy holdings to make their portfolio look good. Our analysis is as follows:
For the S&P 500 index and bitcoins, we look at trading volumes on the last day for every quarter. For the S&P 500 index, we look at the last 30 years, while for bitcoins we look at the last five years. We assign a postiive one when the trading volume is higher than the 30-day trailing moving average, and a negative one when it's not.
For the S&P 500 index, this analysis shows clear bull and bear markets, specially around 1998-2000 and 2008. For the bitcoin trading volumes, there's no discernable pattern to speak of.
The SQL
Data retrieved from CoinGecko, Cryptocompare and Bitcoinity.
Here's the SQL code you can use as a template for your analysis.
Query 1: How correlated are cryptocoins with each other
We use PostgreSQL's corr function to calculate correlations between time series. We further breakdown the timeseries by quarters.
select [crypto.eth_usd_jpy_cny.ts:quarter] as "quarter",
    corr(btc_usd, eth_usd) as "btc eth corr",
    corr(eth_usd, xmr_usd) as "eth xmr corr",
    corr(btc_usd, xmr_usd) as "btc xmr corr"
from crypto.eth_usd_jpy_cny,
    crypto.btc_usd_jpy_cny,
    crypto.xmr_usd_jpy_cny
where crypto.eth_usd_jpy_cny.ts = crypto.btc_usd_jpy_cny.ts
    and crypto.xmr_usd_jpy_cny.ts = crypto.btc_usd_jpy_cny.ts
group by 1
order by 1
Query 2: What's the Japanese exposure to cryptocoin prices
The proportional chart was done on the visualization layer. If you're interested in doing it in the SQL, Percentage of total sum shows you how.
select [ts:month],
        sum(usd_volume) as "us dollars",
        sum(jpy_volume) as "japanese yen",
        sum(cny_volume) as "chinese yuan"
from crypto.btc_volume
group by 1
order by 1 desc
Query 3: Are Initial Coin Offerings sustainable
We find the first date a currency started trading with the caveat that it might not be the ICO date. We then calculate a cumulative sum using window functions.
select ts,
    sum(count(*)) over (order by ts)
from
    (select currency_code,
            date_trunc('month', min(time)) as ts
    from crypto.crypto_prices
    group by currency_code
    order by 2 ) a
group by ts
order by ts
Query 4: Crytocoin liquidity
We use window functions to compute month-over-month growth rates in trading volumes.
select [ts:month],
    sum(volume_btc),
    sum(volume_btc) - lag(sum(volume_btc), 1) over (order by [time:month])
from crypto.crypto_prices
where currency_code = 'xmr'
    and ts > '2017-01-01'
group by 1
Query 5: End-of-quarter volatility
A couple of tricks here:
- We find the last day of the quarter by truncating the date to a quarter (which resets the date to the first day), adding three months and subtracting one day
- Use a
CASEstatement to zero out days that are not the last day of the quarter - Calculate a simple 30-day moving average for the time series
- Use another
CASEstatement to assign +1 and -1 for days that are higher or lower than the moving average - Summing up the volatility by year to identify bull / bear years
select [ts:year],
sum ( case when last_day - ma > 0 then 1 else -1 end )
from (
    select [date:day] as ts,

        case when (date_trunc('quarter', date) + interval '3 month - 1 day')::date = date::date
        then volume
        else 0
        end as last_day,

        avg(volume) over (order by date rows between 30 preceding and current row) as ma
    from crypto.sp_volume
    where date > '1980-01-01'
    order by 1
) a

where last_day > 0
group by 1
order by 1
No spam, ever! Unsubscribe any time. See past emails here.