Line, Bar & Area Charts
Overview
Line, Bar and Area charts are special class of charts that have atleast two columns. One of the columns can be plotted along the X axis and the rest along the Y axis.
Data format
| X Axis | Y Value |
|---|---|
| x1 | y1 |
| x2 | y2 |
| x3 | y3 |
Picking what to plot
The series tab allows you to pick what column goes on the X axis, what columns go on the Y axis or Y2 axis. You can additionally pick colors for the series or make a single chart have multiple chart types.
Customizations
For Line Charts:
- None
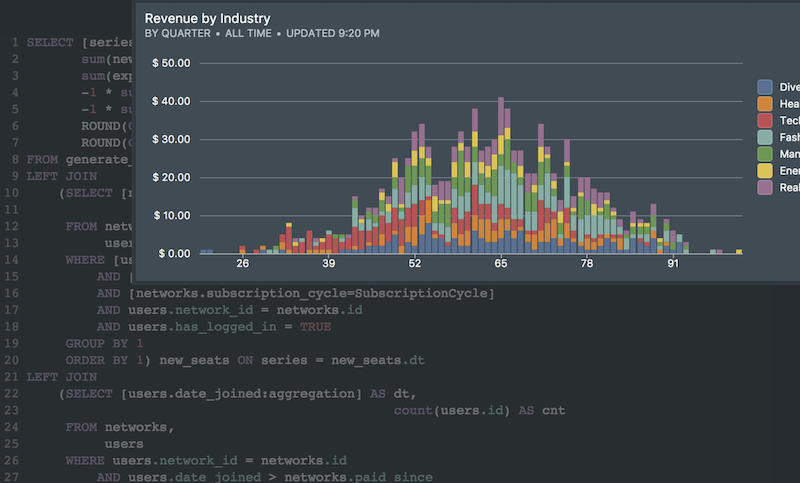
For Bar Charts:
- Stacked Bar - stacks the bars over each other rather then side-by-side
- Proportional Bar – scales each series plotted at a X value to sum to be 100%
- Horizontal Bar – present as horizontal bars rather than columnular bars
For Area Charts:
- Stacked Area - stack the series over each other rather than over laying them
- Proportional Area – scales each series plotted at a X value to sum to be 100%
Next Generation SQL Data Analysis
Write SQL, visualize data, and share your results.
 Onboarding forward-thinking teams now:
Onboarding forward-thinking teams now:
No spam, ever! Unsubscribe any time. Learn more about the product.