Making GeoJSON Choropleth Maps
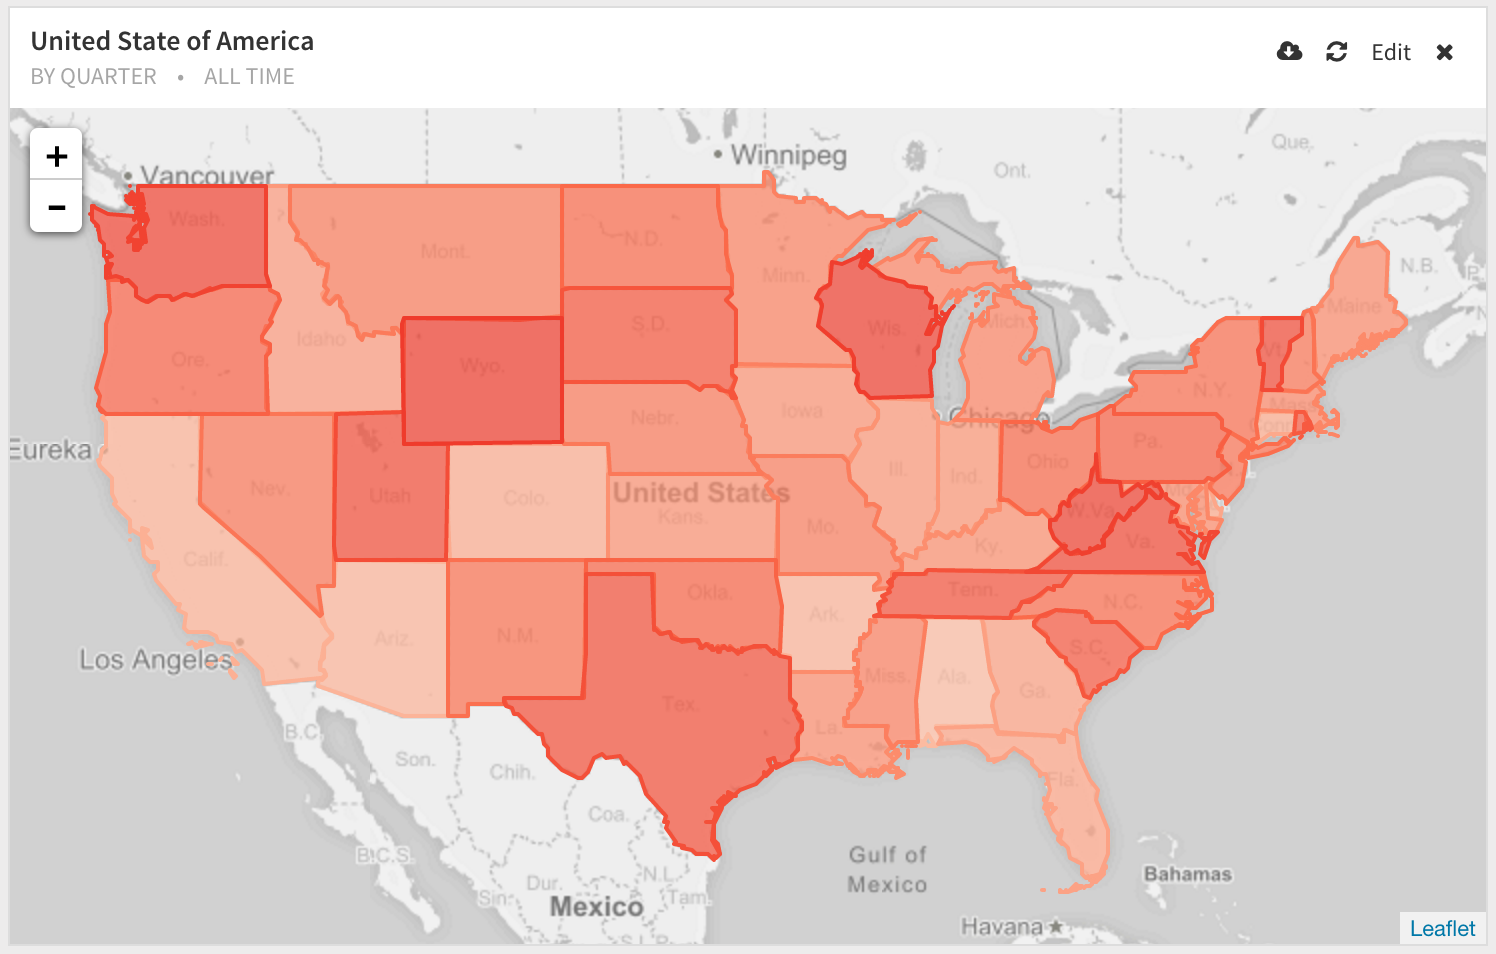
Choropleth maps are a popular and timeless data visualization format. They quickly and efficiently visualize data with geographical dimensions.
Data format
The query needs to return a numeric column that will be used to color the choropleth.
| Geom | Intensity |
|---|---|
| (geojson document) | (numeric value) |
| ... | ... |
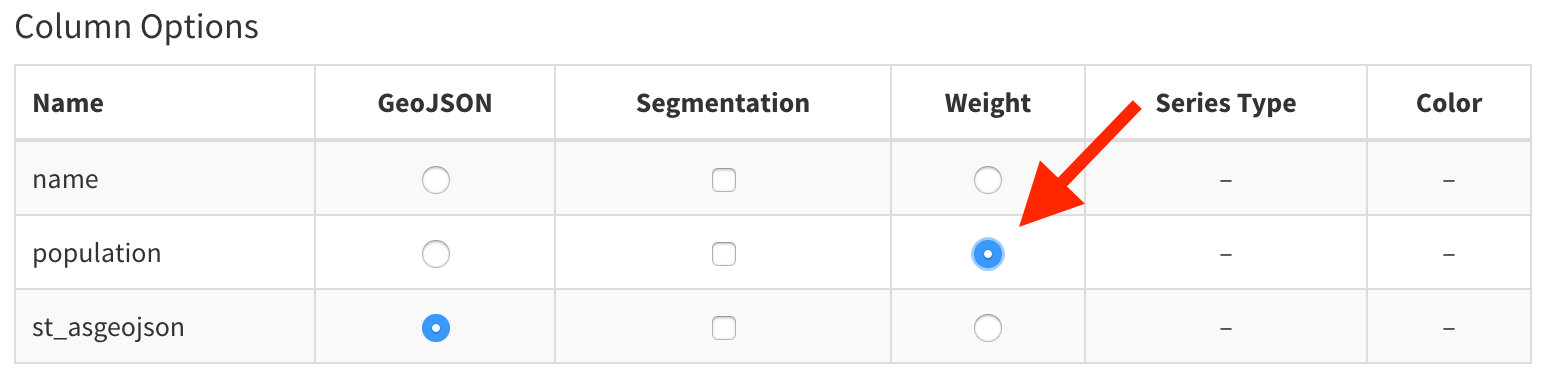
Pick a column for the Weights
On the series tab, pick a numeric column that can be used as weights.
Color Intensity based on Weights
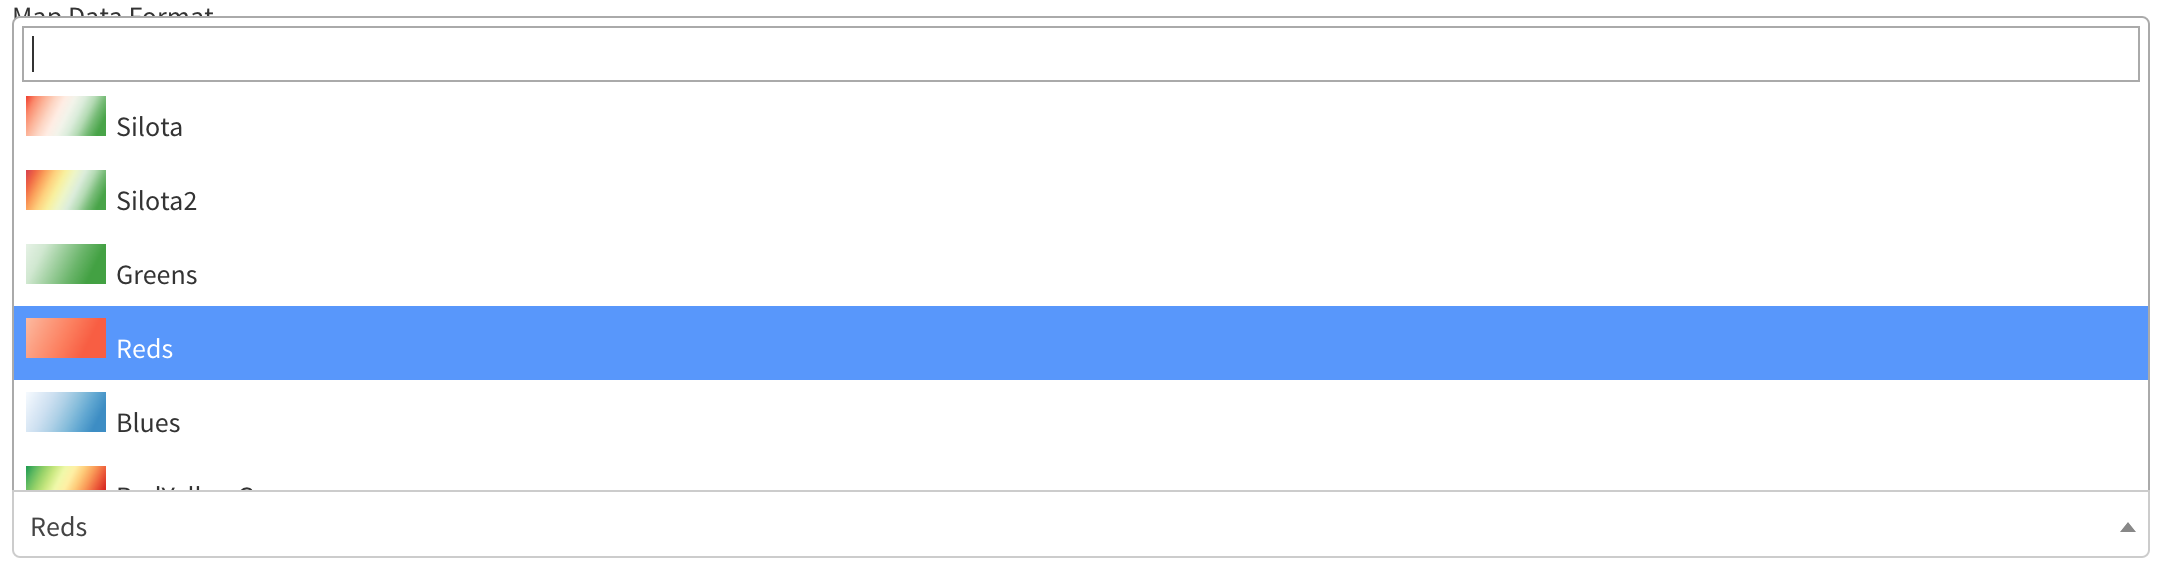
Silota supports a variety of color schemes you can use to color the choropleth. The gradient end values are set to the maximum and minimum values seen in the weight column. The weight is scaled onto the gradient to color the choropleth.
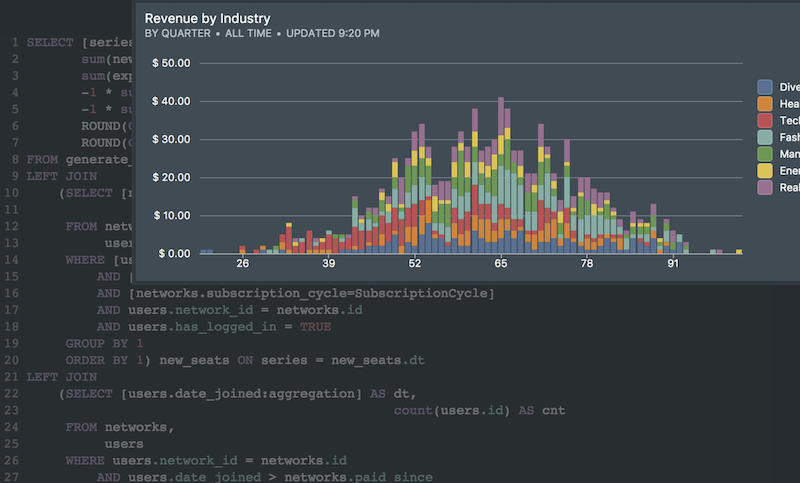
Next Generation SQL Data Analysis
Write SQL, visualize data, and share your results.
 Onboarding forward-thinking teams now:
Onboarding forward-thinking teams now:
No spam, ever! Unsubscribe any time. Learn more about the product.