Forecasting when you have Seasonal effects using the Ratio to Moving Average method in SQL
Many sales activities, product adoption and other business activities – customer support, website traffic, etc. show two kinds of patterns: a upward/downward trend and a seasonal variation. For example, not only has Amazon's revenue been trending up (growing) year after year for the last 20 years, but also shows seasonality with most of the sales made in the last four months of year (specially during Black Friday and Christmas.)
As a data analyst, if you were interested in knowing whether sales is trending up or down – the seasonality will throw you off. The sales for January and February is always less than December (because of Christmas) and without correcting for seasonality, it would appear that sales is trending down.
Modeling seasonal effects is important in order to accurately predict how you need to provision resources and maintain sufficient lead time. The ratio-to-moving average method is an easy to use method to pick out the seasonal effects and forecast future values.
1. Determine a Seasonal Index using Moving Averages
Consider a table "amazon_revenue" with two columns: quarter and revenue. With the following query:
select quarter,
       revenue
from amazon_revenue
order by quarter asc
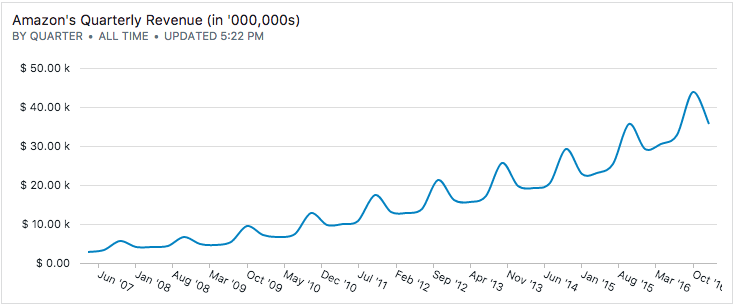
the chart shows Amazon's revenue over the last 10 years for 40 quarters straight. The last quarter of every year shows a big jump year after year, alluding to the seasonal nature of retail sales.
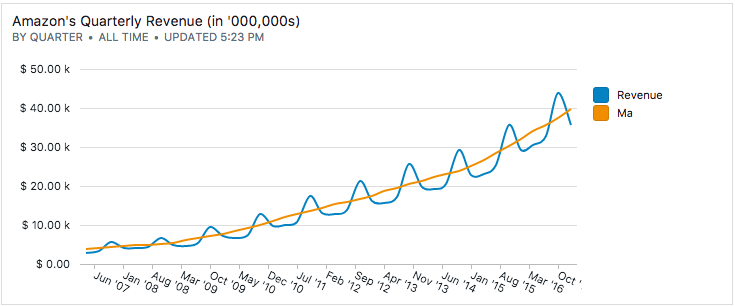
Our first step is to deseasonalize the time series. We'll do this using a 4-quarter moving average:
select quarter,
       revenue,
       avg(revenue) over (order by quarter rows between 1 preceding and 2 following) as ma
from amazon_revenue
order by quarter asc
To compute the seasonal index, we simply divide the actual revenue by the moving average. A seasonal index of 1.75 means that the revenue for the quarter is 175% of the moving average, while an index of 0.5 means the revenue is half the average.
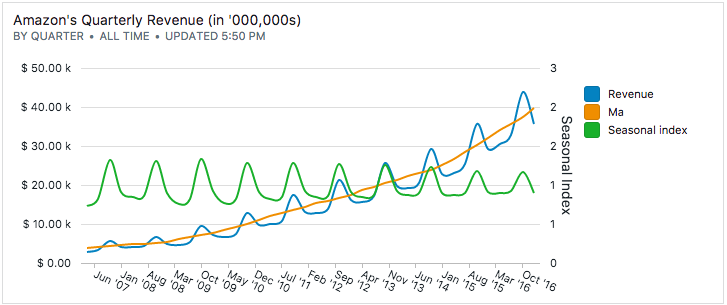
We'll take the analysis one further step and average the seasonal indices across the entire time series:
select date_part('month', q) as d,
       avg(revenue * 1.0 / ma) as si
from
    ( select row_number() over (order by quarter) as n,
            [quarter:quarter] as q,
            revenue,
            avg(revenue) over(order by quarter rows between 1 preceding and 2 following) as ma
    from amazon_revenue
    order by q asc) c
group by 1
which will give us a lookup table:
| d | si |
|---|---|
| 1 | 0.9121396120732432 |
| 4 | 0.8246402054415246 |
| 7 | 0.8599421103521137 |
| 10 | 1.2633667197200424 |
2. Identifying the trend portion of the time series
The previous section showed us how to pull out the seasonality component. Next, we'll pull out the trend portion of the time series. Intuitively, Amazon's revenue is trending upwards year-over-year. We can run a regression using least squares to identify the trend portion.
We refer to our previous recipe for the mathematical background: Calculating Linear Regression Coefficients in SQL.
We'll take a shortcut and use PostgreSQL's regr_slope and regr_intercept to compute the regression line's slope and intercept. If you're not using PostgreSQL, you can compute these coefficient using the afore mentioned link on Linear Regression.
select regr_slope(ma, extract(epoch from quarter)) as slope,
       regr_intercept(ma, extract(epoch from quarter)) as intercept
from (
    select quarter,
        revenue,
        avg(revenue) over (order by quarter rows between 1 preceding and 2 following) as ma
    from amazon_revenue
    order by quarter asc
) a
3. Forecasting using Deseasonalized data
By combining the regression as well as the seasonality index, we have now acquired the capability to forecast future sales!
To actually perform the forecast, we'll project the trend line from the linear regression into future periods, and then adjust these trend values to account for the seasonal factors.
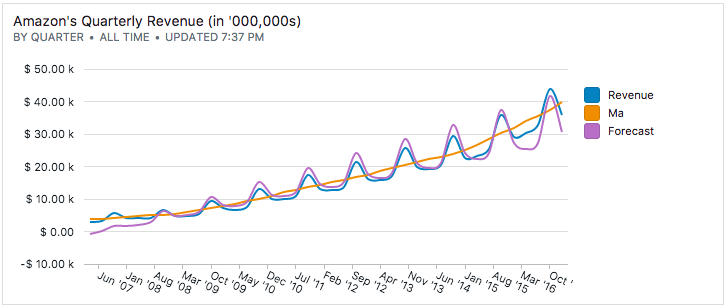
The final SQL appears to be verbose, but we've just refactored it:
with base as
    ( select n,
            q,
            revenue,
            ma
    from
        ( select row_number() over (order by quarter) as n,
                [quarter:quarter] as q,
                revenue,
                avg(revenue) over(order by quarter rows between 1 preceding and 2 following) as ma
        from amazon_revenue
        order by q asc ) b),


    si as
    ( select date_part('month', q),
            avg(revenue * 1.0 / ma) as si
    from
        ( select row_number() over (order by quarter) as n,
                [quarter:quarter] as q,
                revenue,
                avg(revenue) over(order by quarter rows between 1 preceding and 2 following) as ma
        from amazon_revenue
        order by q asc) c
    group by 1 ),


    trend as
    ( select
            regr_slope(ma, n) as slope,
            regr_intercept(ma, n) as intercept
    from
        (select row_number() over (order by quarter) as n,
                [quarter:quarter] as q,
                revenue,
                avg(revenue) over(order by quarter rows between 1 preceding and 2 following) as ma
        from amazon_revenue
        order by q asc) a
    )


select base.q,
    base.revenue,
    base.ma,
    trend.intercept + trend.slope *  base.n * case date_part('month', base.q)
                                                    when 1 then 0.9121396120732432
                                                    when 4 then 0.8246402054415246
                                                    when 7 then 0.8599421103521137
                                                    when 10 then 1.2633667197200424
                                                end as forecast
from trend,
     base
No spam, ever! Unsubscribe any time. See past emails here.