Modeling: Denormalized Dimension Tables with Materialized Views for Business Users
Your data warehouse has:
- dimension tables containing categorization of people, products, place and time – generally modeled as one table per object.
- fact tables containing measurements, metrics and facts of a business process.
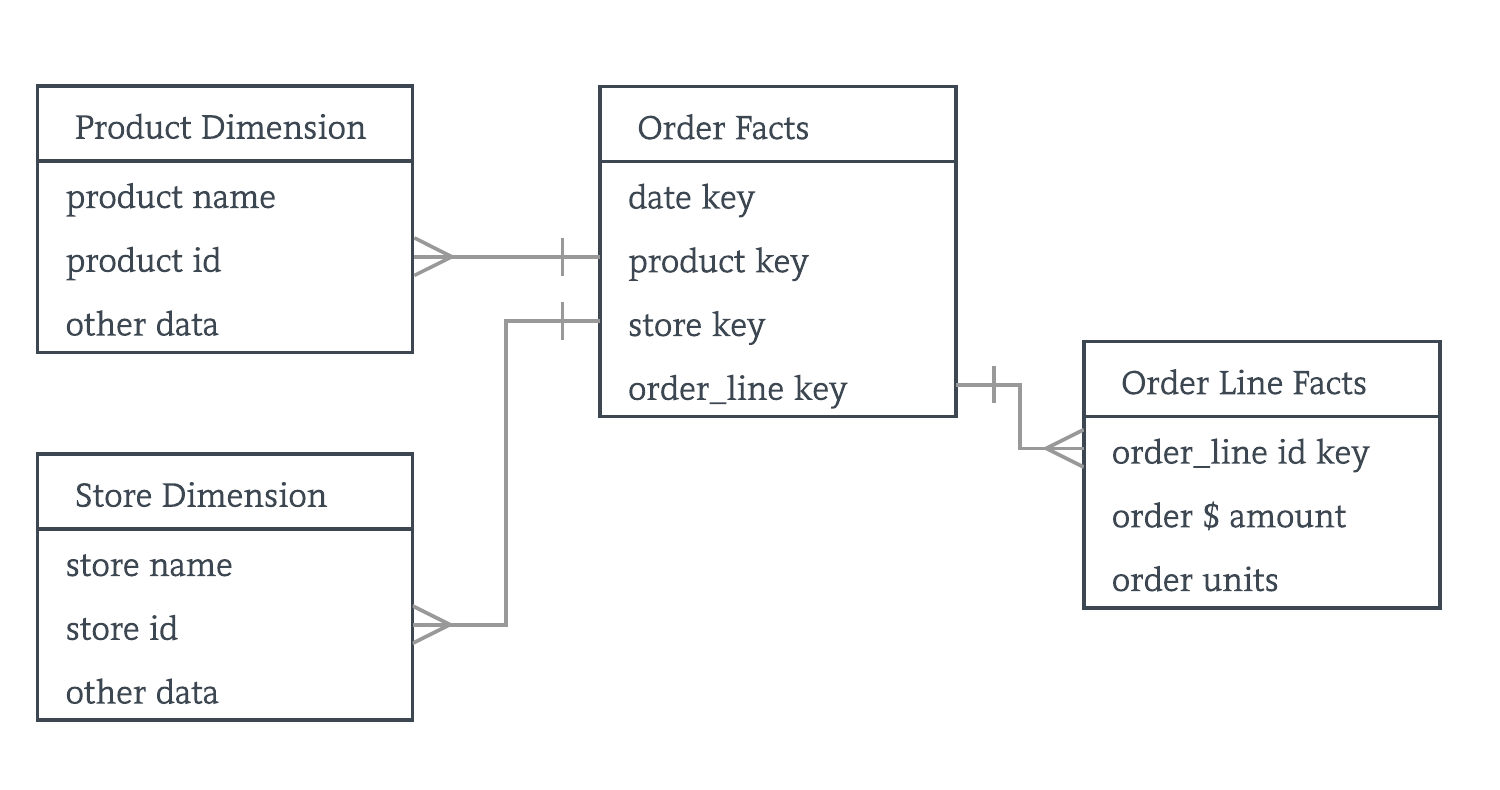
For example, an e-commerce store will have an order and order_line fact tables recording each order and its associated order line items. The product and store dimension tables are related via the foreign keys.
This simplistic model is for illustration purposes only – a more complete model will contains fields for product categories, shipping options, sales persons, etc.
A data analyst can then calculate various metrics such as sum of orders per store, or sum of orders per category, or sum of orders per day/week/month etc. You get the idea.
While a normalized database model like the above makes sense to a data analyst and is absolutely necessary for your transaction / application database to ensure data consistency, it makes adhoc queries significantly harder for business users. Business users balk at joins and find it conceptually hard to understand. There are plenty of visual tools to create joins, but it's debatable whether it solves the problem of knowing what kind of join to use.
Let's investigate an approach to improve the usability of your data warehouse.
1. Approaches for business users to engage with data
Static reports at the end of the month are one thing and it's alright for a data analyst to work with the normalized table format. To truly unlock the value of your data – every line employee and manager should be able to engage with the data without the need to recruit a data analyst.
In our experience, there are three approaches of varying levels of success, each with it's own caveats:
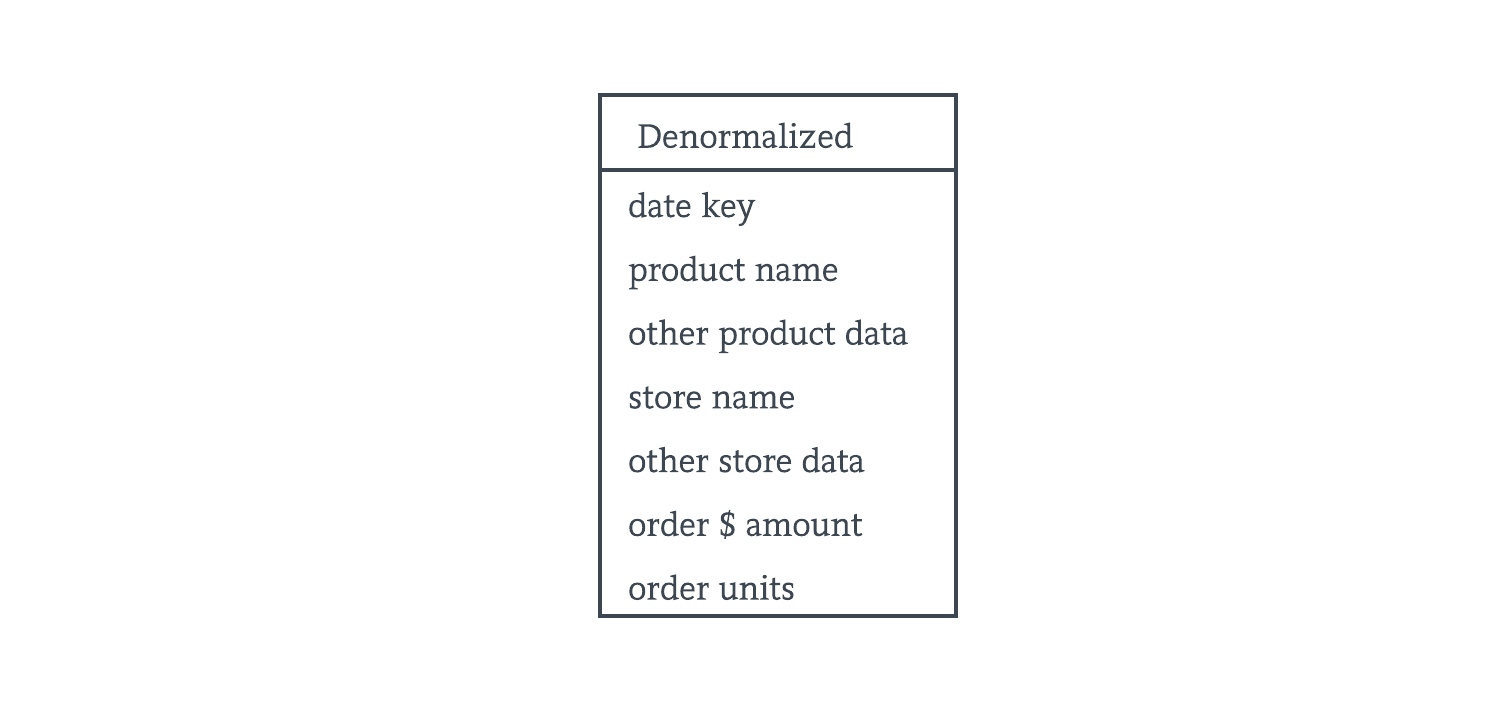
Denormalization – create a view (materialized for performance) that denormalizes the dimension tables and presents a flat structure. Business users are used to exploring data in spreadsheets, which is denormalized. They can then aggregate on measures, pivot on dimensions, etc.
Data modeling – use a layer to build a semantic model of the relationships between the tables. Present a tree-like schema browser that allows the business user to "drill-down" a join path and create a tabular end result, without ever having to know or touch SQL.
One query to rule them all – use a templating language over SQL to implement pluggable
WHEREclauses and present a point and click interface to enable a business user to modify the query, without having to know or touch SQL.
2. Denormalized dimension tables
Our recommendation is to "cache" a denormalized version of the relational data model. You can accomplish this using technology that's already built into your database and no external software is needed. An additional advantage is that you could potentially see performance improvements with a specialized columnar database like Amazon Redshift or Google Bigquery.
The biggest win is usability. You've reduced numerous dimension tables into one table. It's not uncommon to see a business process contain 20 or more dimension tables.
To create a table like the above, you can join all of the dimension tables into one giant table. You can then refresh this table periodically depending on your needs. Every night seems to work for most cases. Any changes to the dimension tables, like store name, will be captured on the next refresh.
with products as (
    select * from products_table
),
stores as (
    select * from stores_table
),
orders as (
    select * from orders_table
),
order_lines as (
    select * from order_lines_table
),

joined as (
    select
        order_lines.order_id,
        order_lines.amount,
        order_lines.units,
        orders.date,
        products.name,
        products.other_data,
        stores.name,
        stores.other_data
    from order_lines
    left outer join orders on order_lines.order_id = orders.id,
    left outer join products on orders.product_id = products.id
    left outer join stores on orders.store_id = stores.id
)

select * from joined
From the single joined table, it's still possible to calculate various metrics such as sum of orders per store, or sum of orders per category, or sum of orders per day/week/month as before. No functionality is lost.
3. Store the denormalized dimension table as a database View
A database view creates a pseudo-table and from the perspective of a select statement, it appears exactly as a regular table. In PostgreSQL, views are created with the create view statement:
create view <view_name> as
    select <column1>, <column2>, ....
    from <table_name>;
The view is now available to be queried with a select statement. As this is not a real table, you cannot delete or update it. The underlying query is run every time you query the view.
If you want to store the result of the underlying query – you’d just have to use the materialized keyword:
create materialized view <view_name> as
    select <column1>, <column2>, ....
    from <table_name>;
You now control the upgrade schedule of the view and can be refreshed at your convenience:
refresh materialized view <view_name>;
No spam, ever! Unsubscribe any time. See past emails here.