SQL Dashboards Overview
Silota's interactive SQL-based dashboards are how you organize your charts, setup sharing, embed them and use them to present to your stackholders for reporting purposes.
1. Creating a dashboard
There are two ways to create a new dashboard:
- Through the main page, click on "Start with a new dashboard"
- Through the navbar on the left handside of the application
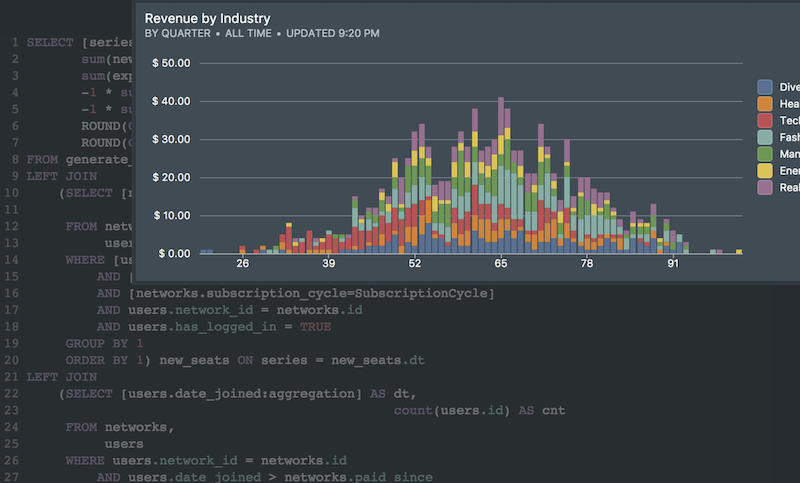
Once you create a new dashboard, you are presented with an empty dashboard:
![]()
2. Configuring the dashboard
All configuration options are available through the "Configure dashboard" dropdown menu:
2a. Arranging dashboard charts
Dashboard charts are organized a grid, and each chart can have custom rectangular dimensions and coordinates.
2b. Clone and delete dashboard
Cloning allows you to make a shallow copy of the current dashboard charts to a new dashboard. This can be useful when you want to use the same underlying chart on two dashboards, but want to have a different subset or a different arrangement of charts on the dashboard.
Deleting will delete the dashboard. This action cannot be undone. If your dashboard is shared with your team, deleting it will remove access to it.
2c. Refresh dashboard
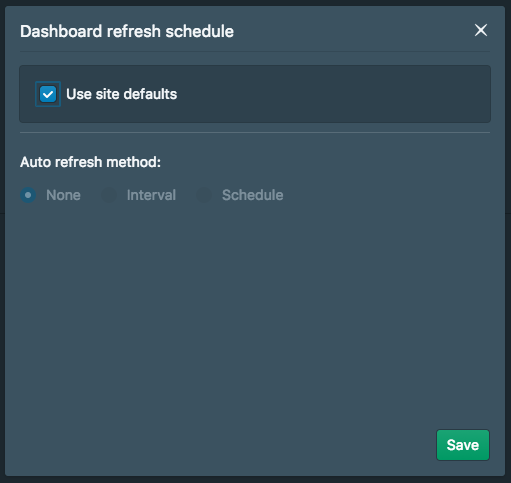
You can setup automated refresh schedules for the current dashboard. By default, the refresh schedule follows the overall site defaults (which is 24 hours if not set, but can be configured.)
Read more on dashboard refresh schedules.
2d. Embed dashboard
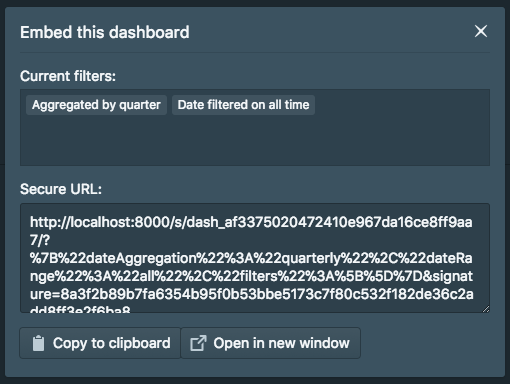
You can securely embed the current dashboard with the current set of filters for external applications. If you were to change your API Key, all external embeds will become invalid.
Read more on dashboard embedding.
2e. Schedule dashboard through Email and Slack
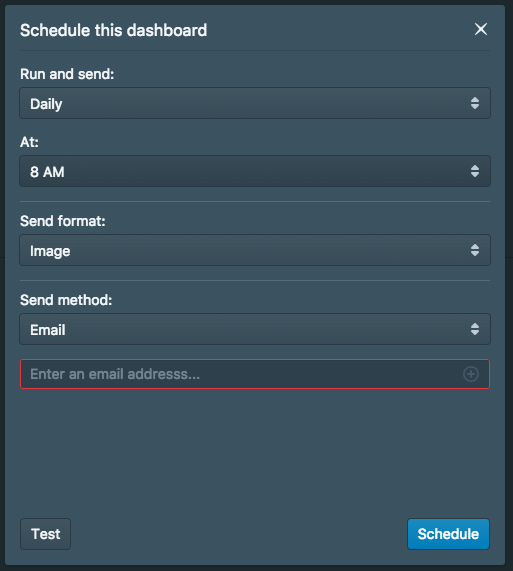
You can configure a scheduled job to take a screenshot (as an image or a PDF) and send the screenshot as an email attachment, or a Slack message at a predermined time.
Read more on dashboard scheduled reports.
2f. More configuration options
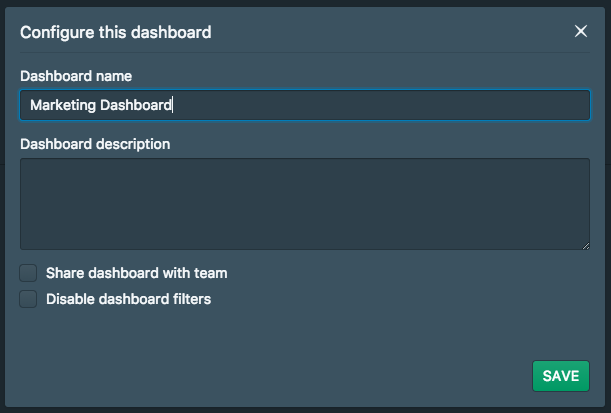
Here you can rename your dashboard, share the dashboard with your team or disabled showing dashboard-wide filters (useful when your charts don't use any charts.)
 Onboarding forward-thinking teams now:
No spam, ever! Unsubscribe any time. Learn more about the product.