Guide to White-Label Embeded Dashboards & Reports
Delight your customers with Silota's white label SQL-powered dashboards and reports.
How we designed this feature
Silota's white label reports are designed to meet three key capabilities:
- Customizable: complete control over every aspect of the dashboard, including colors, layout and formatting
- Scalable: one dashboard can serve the needs of your entire customer base
- Secure: uses bank grade security to ensure your data privacy
Example dataset
As a companion to this guide, we've put together some sample data from an ecommerce platform like Shopify. Shopify allows their customers to create stores, add products and sell these products to their customers' customers. The Shopify platform schema might look like this:
A table store for a list of stores and their metadata:
| id | name | country |
|---|---|---|
| 1 | Faucet Face | China |
| 2 | Good As Gold | Philippines |
| 3 | Skinny Teatox | Brazil |
| 4 | Chalkd | Germany |
| 5 | Ratio | Ukraine |
| ... | ... | ... |
A table product for a list of all products and categories for the entire platform. The products belonging to a specific store can be looked up via the store_id foreign key:
| id | store_id | category_name | product_name | price |
|---|---|---|---|---|
| 1 | 1 | Books | Art of War | 2.00 |
| 2 | 1 | Books | Eatery | 3.00 |
| 3 | 2 | Coffee Machine | Machine Wash | 17.00 |
| 4 | 2 | Coffee Filter | Kone | 19.00 |
| ... | ... | ... | ... | ... |
A table order for a list of orders made against a particular store and product via the store_id and product_id foreign keys:
| id | date | store_id | product_id | quantity |
|---|---|---|---|---|
| 1 | 2017-01-01 | 1 | 2 | 4 |
| 2 | 2017-02-02 | 2 | 3 | 10 |
| ... | ... | ... | ... | ... |
Step 1: Prepare your data with SQL
The first step is to write a query for one specific customer. In our example, we will pick the customer "Good As Gold" with the id of 2.
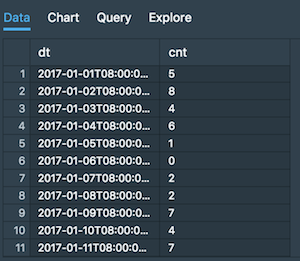
We are interested in a total count of the orders on a particular day as a timeseries.
select [date:day] as dt,
       count(*) as cnt
from order
-- start hardcoded
where store_id=2
-- end hardcoded
group by 1
order by 1;
which will result in a data table like this:
Additional Notes
- We are making use of Silota's SQL Macros in order to truncate the date. The macro supports a variety of truncation formats that are compatible across different databases like MySQL, PostgreSQL, SQL Server, etc.
- Make sure you have data for dates where there are no orders. You'll need to manually fill the discontinuities by generating a date series and using a left join.
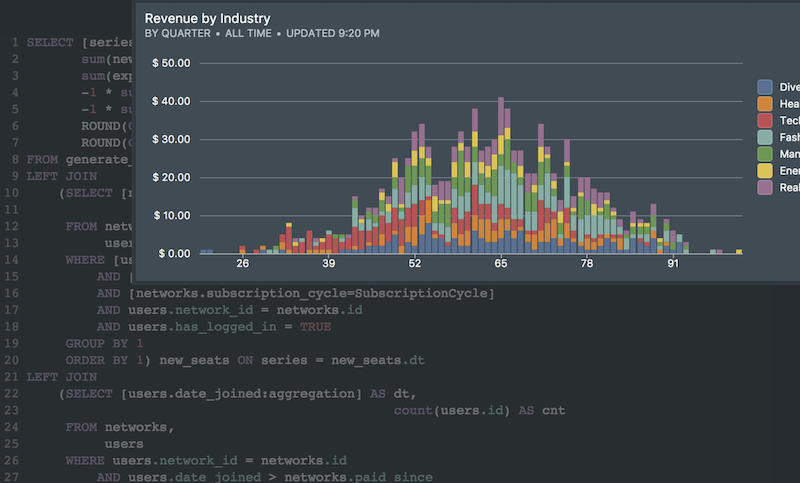
Step 2: Customize your visualization
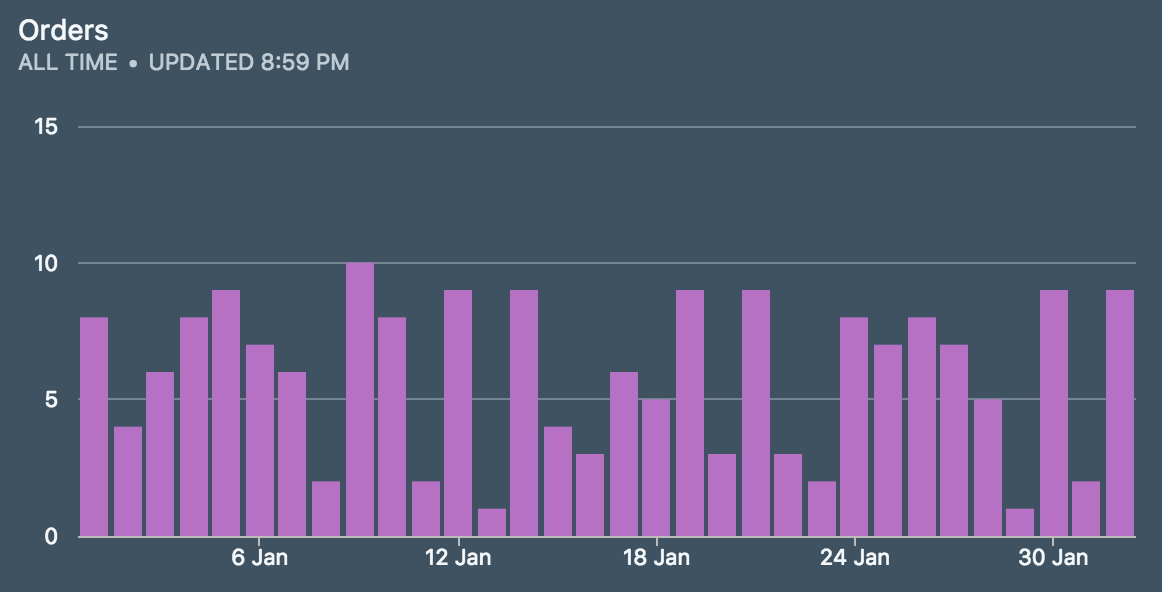
We'll want to pick the right kind of visualization and customize the look and feel to suit our brand. After we've picked the chart type, the colors, named the chart, etc. we should end up with a chart like the following:
Additional Notes
- Pick the right chart for your visualization
Step 3: Add dashboard-wide filters
Our next step is to make the query dynamic and remove the hardcoded value of store_id=2. We can accomplish this in two parts:
Step 3a. Create a dashboard filter "StoreFilter"
First, we create a filter called "StoreFilter" that dynamically gets populated with the list of store names and their associated ids. We do this using SQL:
select id, name from store;
The SQL will need to return two columns: a value and a display label. The display label can be used to format how it looks on the front-end, for example you can concat two fields (first_name || last_name) to show the end-user. You can additionally sort the results with an order by clause or exclude stores that are inactive, if needed.
Hit the "Validate" button to verify that the SQL returns what you are expecting.
Once the filter has been added, it'll look like this on the dashboard:
Step 3b. Modify the chart SQL to use the filter
You can now remove the hardcoded value of store_id=2 with the filter definition:
select [date:day] as dt,
       count(*) as cnt
from order
-- start filter
where [store_id=StoreFilter]
-- end filter
group by 1
order by 1;
Step 3c. Modify the chart title to reflect the filter (optional)

Additionally, modify the chart title with the filter name in it. If you changed the name to "[StoreFilter]'s Orders", then the right filter value will be substituted in the chart title. For example, "Chalkd's Orders" or "Good As Gold's Orders".
Additional Notes
- Everything you need to know about dashboard filters including date ranges, date aggregation, parent-child filters, etc.
Step 4: Ship it!
Repeat step 3 any number of times for each chart and each dashboard filter. The next step is to embed this dashboard externally. If you open the Embed dialog, you'll find the filter definition:
It's a JSON blob that can apply the filters and configure the dashboard:
{
    dateAggregation: "monthly|quarterly|etc.";
    dateRange: {
        "start": "2017-10-01T19:00:00.000Z",
        "end": "2017-10-31T19:00:00.000Z"
    },
    filters: [
        {
            "filterId": "df_b58dbadb536742a8bb5020d8fb860680",
            "value": 4,
            "label": "Chalkd"
        },
        ...
    ]
}
You can programatically change the JSON blob and have the dashboard reflect the new set of filter parameters. To load the dashboard, you'll need to load a special URL of the form:
https://console.silota.com/s/<dashboard_id>/?{filters}&darkMode={true|false}&showHeader={true|false}&signature={signature}
The four parts to the URL are:
- filter parameters – which is the URL encoded version of the JSON blob above
- darkMode – a toggle between light and dark mode
- showHeader – a toggle for the dashboard header with the name and logo
- signature – a SHA256-HMAC of your API key and the complete URL path, including the JSON blob
The signature will have to be generated on your backend to ensure the URLs generated are secure. See the links in the following section for sample code on how to generate the signature.
Additional Notes
Testing it
Create a simple HTML page with the following source:
<html>
    <head>
        <title>Embed example</title>
    </head>
    <body>
        <h1>Embed example</h1>
        <iframe width="100%" height="100%" style="border: none;" src="..."></iframe>
    </body>
</html>
 Onboarding forward-thinking teams now:
No spam, ever! Unsubscribe any time. Learn more about the product.