Analyzing Net Promoter Score (NPS) surveys in SQL to improve customer satisfaction & loyalty
Net promoter score is an industry standard for measuring customer loyalty. Besides the quantitative approach to understanding your customers using usage data / activation rates – a qualitative approach is also important. Sometimes how your customer feels qualitatively about your company / service matters much more than what quantitative numbers can tell you.
In this recipe, we'll go beyond the regular NPS calculations to improve the customer experience. We'll analyze the qualitative aspects using verbatim text analysis of a NPS survey to uncover retention and churn issues hidden in the data.
1. How is NPS calculated
Net promoter score is calculated by asking your customers a single question:
"How likely are you to recommend our product/service/company to a friend or colleague?"
They are then presented with a single 11-point scale from 0 to 10 to answer this question. The scores are then aggregated into three distinct groups:
- detractors (0-6)
- neutral (7-8)
- promoters (9-10)
The net promoter score is the difference between the number of promoters and detractors (as a percentage of the whole population.) The scores can range from -100 to 100. Companies run these surveys regularly to understand the evolution of NPS over time and your ability to satisfy customers.
NPS calculation example
If you surveyed 100 people, and you get the following results:
- detractors: 20%
- neutrals: 10%
- promoters: 70%
The net promoter score is 70 - 20 = 50.
2. Collecting qualitative data (verbatim text)
Most NPS surveys also ask a follow-on question:
"Why did you give our company/product/service a rating of [customer's score]?".
The open-ended question can be more insightful than the quantitative score because it can instruct a direct course of next action.
3. NPS analysis in SQL
The data you collect from running a NPS survey falls into two categories:
- the numerical score
- the verbatim text
For the purposes of this recipe, we'll be analyzing the iTunes app store reviews of the Duolingo app. We scraped 5000 reviews from iTunes. The data we scraped is going to be organized into a table with the following schema:
| id | date | username | score | verbatim |
|---|---|---|---|---|
| 1 | 2017-08-08 | Alice | 5 | Best app ever to learn english |
| 2 | 2017-08-07 | Bob | 4 | Very addictive, almost game-like. |
| 3 | 2017-08-06 | Eve | 5 | Nicely done. Would be even better with a dedicated basics/travel category for those who want to learn enough to visit a country and be polite while asking directions, booking a room or buying a train ticket etc etc. |
| 4 | 2017-08-05 | Dan | 2 | Add Korean. |
| ... | ... | ... | ... | ... |
The app store views are scored on a scale of 0-5, but for our purposes, we'll scale the score to 0-10.
4. Analysis on the quantitative data
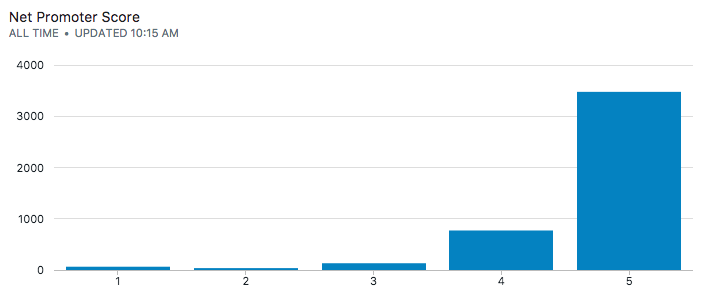
4a. Distribution of scores
Our first analysis is to look at the distribution of scores to make sure everything checks out:
select score, count(*) from reviews
group by score
order by score
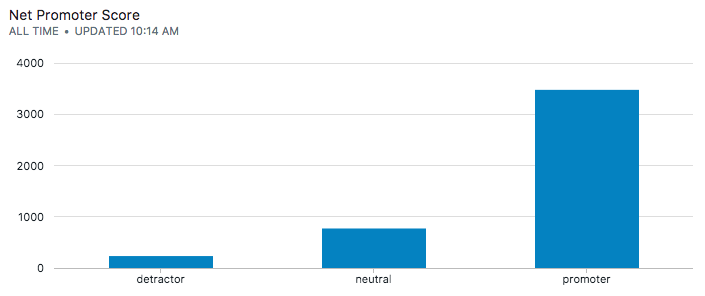
But really want to use the standard terminology: "detractor", "neutral" and "promoter". We'll use the mapping:
- detractor (0-3)
- neutral (4)
- promoter (5)
and a sql case statement to categorize the scores.
select case
    when score = 5 then 'promoter'
    when score = 4 then 'neutral'
    else 'detractor'
end as label, count(*)
from reviews
group by label
order by label
4b. Calculating the score
select sum(npscore * c)  * 100.0 / (1.0 * sum(c)) from (
    select case
        when score = 5 then 1
        when score = 4 then 0
        else -1
    end as npscore, count(*) as c
    from reviews
    group by npscore
    order by npscore
) x

You'll definitely want to compare this score against the competition in your industry. For the case of Duolingo, a score of 72 is comparable to what Apple has achieved. Pretty good!
What's more interesting is how this score evolves over time – which is what we'll calculate next.
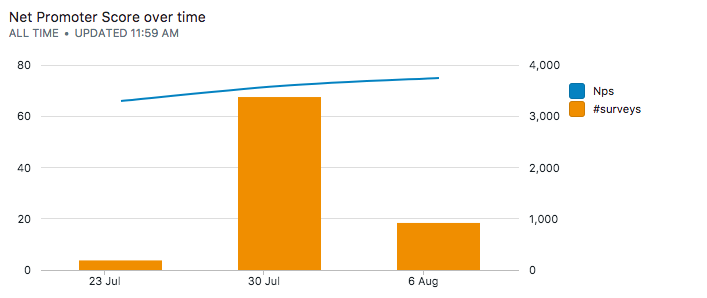
4c. NPS over time
Since we have a date column in our initial schema, we can chart a time series to see how customer satisfaction trends over time.
select dt,
       sum(c) as "#surveys",
       round(sum(npscore * c)  * 100.0 / (1.0 * sum(c)), 0) as nps from (
    select [date:week] as dt, case
        when score = 5 then 1
        when score = 4 then 0
        else -1
    end as npscore, count(*) as c
    from reviews
    group by dt, npscore
    order by dt, npscore
) x
group by dt
4d. NPS by app version, by paying users and other segments
We can use a similar SQL as above to segment the scores by any dimension of interest: app versions, paying users, acquisition channel, total spend/revenue, etc.
5. Text Analysis on the qualitative data
We next turn our focus to the verbatim text portion of the surveys. Text analytics is more difficult to achieve because free-form text can come in all kinds of shapes and sizes. We'll build a sequence of steps to clean the data and make them comparable. While this is not as sophisticated as some of the dedicated text analysis engines out there – SQL can get us quite far. We are going to be relying heavily on --> regular expressions <-- to do the processing.
5a. Cleaning the data
The steps we'll use to clean the data is similar in scope to something Elasticsearch comes with out the box to build its search index. We'll be converting the text to lowercase, remove punctuation and other unnecessary characters and finally remove numbers from the text because numbers don't make sense without context.
select text, regexp_replace(regexp_replace(regexp_replace(lower(text),
    '[^\w][\d]+', ' '), '[!\.,]', ' '),
    '\s*', ' ') as cleaned_text
from reviews
gets us cleaned text like this:
| text | cleaned_text |
|---|---|
| Excellent app! | excellent app |
| Great app to learn a language. It uses sentences and hearing the spoken language to learn, which is how native speaking people learned their language. The app is very sufficient now but I'm sure it will evolve and have more built into it. | great app to learn a language it uses sentences and hearing the spoken language to learn, which is how native speaking people learned their language. the app is very sufficient now but i'm sure it will evolve and have more built into it. |
| Such a good app to learn polish! Brilliant | such a good app to learn polish brilliant |
| I love this app! Thanks Dulingo for creating such an easy an informative program to learn new languages. I'm very satisfied and thankful for this program. | i love this app thanks dulingo for creating such an easy an informative program to learn new languages. i'm very satisfied and thankful for this program. |
Next, we'll split each from from a survery answer into its own row with regexp_split_to_table so that it gets easier to aggregation at the end.
with cleaned as (
    select date, regexp_replace(regexp_replace(regexp_replace(lower(text), '[^\w][\d]+', ' '), '[!\.,]+', ' ') , '\s*', ' ') as text,
    score from reviews)
select date, regexp_split_to_table(text, '\s+') as word, score
from cleaned
| date | word | score |
|---|---|---|
| 2017-08-08 | 5 | |
| 2017-08-08 | best | 5 |
| 2017-08-08 | app | 5 |
| 2017-08-08 | ever | 5 |
| 2017-08-08 | to | 5 |
| 2017-08-08 | learn | 5 |
| 2017-08-08 | english | 5 |
| ... | ... | ... |
Next, we'll want to remove words with less than 2 characters and words like 'a', 'to', 'the', etc. These words are known as stop words and usually refer to the most common words in a language.
a, an, and, are, as, at, be, but, by, for, if, in, into, is, it,
no, not, of, on, or, such, that, the, their, then, there, these,
they, this, to, was, will, with
The above words are the stop words used by Elasticsearch search engine for the English language:
with cleaned as (
    select date, regexp_replace(regexp_replace(regexp_replace(lower(text), '[^\w][\d]+', ' '), '[!\.,]+', ' ') , '\s*', ' ') as text,
    score from reviews)

select date, word, score from (
select date, regexp_split_to_table(text, '\s+') as word, score
from cleaned
) x
where char_length(word) > 2
and word not in
              ('a',
               'an',
               'and',
               'are',
               'as',
               'at',
               'be',
               'but',
               'by',
               'for',
               'if',
               'in',
               'into',
               'is',
               'it',
               'no',
               'not',
               'of',
               'on',
               'or',
               'such',
               'that',
               'the',
               'their',
               'then',
               'there',
               'these',
               'they',
               'this',
               'to',
               'was',
               'will',
               'with')
This concludes our data cleaning and preparation!
5b. Words by net promoter score
select score, word, count(word) as c from
(
    // query as above
)
group by score, word
order by c desc
Tells us something super interesting:
| score | word | count |
|---|---|---|
| 1 | korean | 3 |
| 1 | arabic | 1 |
| 1 | urdu | 1 |
| 1 | advertisements | 1 |
| 2 | filipino | 3 |
| ... | ... | ... |
| 4 | spanish | 140 |
| 5 | fun | 132 |
| 5 | awesome | 128 |
| 5 | amazing | 163 |
Our understanding of Duolingo's customers from a small subset of the data is as follows:
- the detractors mostly complain about lacking language support
- users have a neutral response to the Spanish language support
- users use words like "fun", "awesome" and "amazing" and will recommend / promote the app to their peers.
These insights lead to direct action items for your next revision of the app.
5c. Words that promoters and detractors use
We'll now group by the word and pivot across the score to figure out what words are commonly used by the promoters and detractors.
select word,
    sum(c) as volume,
    sum(promoter) / sum(c) as promoter,
    sum(neutral) / sum(c) as promoter,
    sum(detractor) / sum(c) as promoter
from (
    select word, c,
        sum(case when score = 5 then c else 0 end) as promoter,
        sum(case when score = 4 then c else 0 end) as neutral,
        sum(case when score in (3, 2, 1, 0) then c else 0 end) as detractor
    from (

        select word, score, count(word) as c
        from cleaned_reviews
    )
)
Filtering by a subset of languages, it's clear across languages what the customer satisfaction is.
| word | volume | detractors | neutral | promoters |
|---|---|---|---|---|
| spanish | 173 | 80.92% | 15.61% | 3.47% |
| japanese | 110 | 63.64% | 26.36% | 10.91% |
| french | 101 | 78.22% | 17.82% | 4.95% |
| korean | 73 | 43.84% | 32.88% | 23.29% |
| german | 64 | 71.88% | 23.44% | 4.69% |
| italian | 31 | 77.42% | 19.35% | 6.45% |
| hindi | 1 | 0.00% | 100.00% | 0.00% |
No spam, ever! Unsubscribe any time. See past emails here.