The fact is most companies focus more on customer acquisition rather than customer retention. Often overlooked, but paramount to success is calculating metrics on your existing customer base. In this post we explore 5 SaaS metrics that will help you get started.
1. Churn Rates
Churn rate is the percentage rate at which customers stop subscribing to your service during a given time period. Customer churn for a variety of reasons: your internal champion leaves, your customer has decreasing product usage, or poor onboarding. In fact, we have previously written in-depth on why customers churn.
Calculating churn rates accurately can be difficult, but a simple rule of thumb is:
Take all customers you lose during a time frame, say a month, and divide it by the total number of customers you had the beginning of the month. You do not include any new sales from that month.
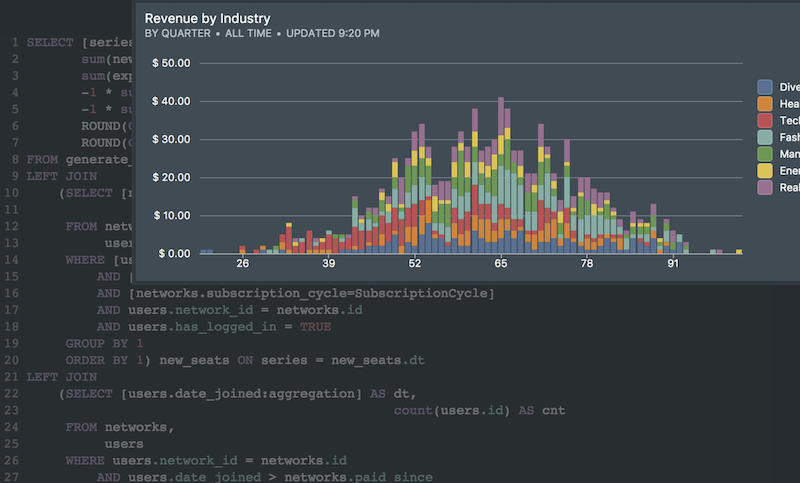
You can also calculate churn as a dollar amount of recurring business lost, or as a percentage of recurring revenue lost. It’s important to see this point of view when you have customers of different sizes and losing one customer could have a big impact on your revenues.
A second layer of insight comes from segmenting these churn rates by other attributes: customer vertical, product tier, annual versus monthly payments, etc. You’d generally find that churn rates are quite different between cohorts of customers.
2. Product Usage Data
Product modules or features are how companies often package and price their products. You’ll want full visibility into how your product features are used and by whom. Analytics around product usage will help guide your product roadmap, enlist features for deprecation, and which features require user training and education to encourage usage.
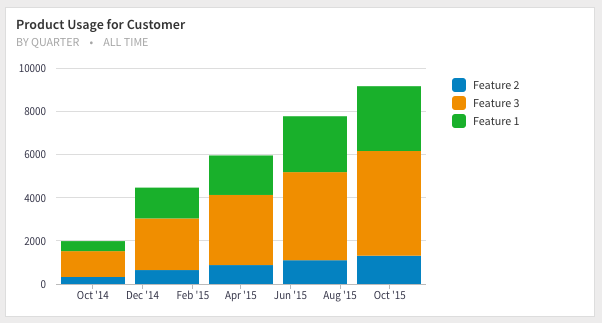
Product Usage data can be defined as data about your customers utilization of your products and service. It is a metered record of customer activity occurring at any given time. For example, usage data can include a page view, a video watched, a song streamed, or a transaction made.
Product Usage puts your customers into two buckets:
- those who have healthy product usage and ideally increasing usage, are finding full value from your product and are candidates for upsell.
- those who have decreasing product usage should get contacted by Customer Success to figure out if there’s a problem.
Just don’t take a “sell it and forget it” approach, as product usage requires constant vigilance.
3. Upsell / Add-on / Expansion Sales
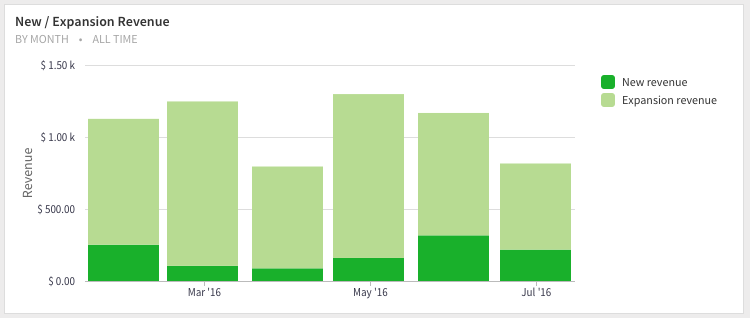
The best companies leave a dimension of freedom in their pricing plans for selling addition product or services. The biggest profitable revenue opportunity is often amongst your current customer base.
Upsells can come in the form of extra seats and licenses / adoption across another department in the organization / more metered usage / additional product modules.
There’s a lot we want to share about upsells, stay tuned for a future post on the this topic. The key insight with upsells is that you’ll want to provide additional support and onboarding via customer success.
4. Customer Lifetime Value
SaaS and recurring revenue businesses spend money on marketing and sales upfront to acquire new customers. They recoup these costs via recurring revenue in small increments as long as they maintain the relationship with the customer. At some point in the future, they breakeven and start to generate profits.
Therefore one true measure of the value of a recurring revenue business is the lifetime value of a customer and how quickly you’re able to breakeven and start generating profits.
CLTV provides great optics into your customer base. In essence, it tells you if you have a lot of high-value, short lifetime customers or vice versa.
CLTV can also help shape your marketing and customer acquisition costs. Because the cost of acquisition is upfront, you need to tap into your cash reserves in order to grow. Knowing your lifetime value and breakeven point can help determine a balance between profits and growth.
5. Customer Health
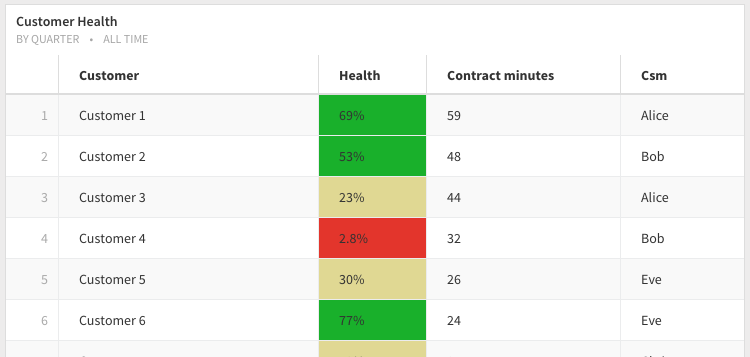
There are many facets of customer health – support happiness, product usage, relationship with the champion, etc. It’s easier to think about your customers when you aggregate all these statistics into a single number that you then use to rank your customers.
In our experience, the two telling factors of customer health are Net Promoter Scores and Product Usage Data.
Customer Health with Net Promoter Score
Net Promoter Score is a customer loyalty metric developed by Fred Reichheld, Bain & Company, and Satmetrix. The 2003 Harvard Business Review article, “One Number You Need to Grow” introduced the concept.
NPS is calculated based on responses to a single question:
How likely is it that you would recommend our company/product/service to a friend or colleague?
The scores places your customers into Promoters, Passives and Detractors.
By tracking NPS over time, each department from marketing to product to sales to support can understand how well their products and services create customer satisfaction and loyalty.
Customer Health with Product Usage Data
We wrote about product usage data above. The key point you’d want to consider is that it needs to be a ratio so that your customers are normalized regardless of their size and you can compare/rank them.
The ratio could come from their current usage versus the usage specified in the contract.
Photo Credit: Unsplash