In Canada, we often believe that the relationship between the English and French languages is central to our identity. Since 1967 (the 100th anniversary of the Canadian Confederation,) both English and French have had official federal status throughout the country. According to the 2011 census, the divide between English-French as a mother tongue is 60%-21%.
What’s often missed is a narrative around other non-official languages spoken by us Canadians. As we dig deeper into the data from the census program, we find far more interesting facts about:
- Canadians and the languages we speak
- where we are geographically dispersed
- the biggest factors contributing to our diversity
- what changes we’ll see in the makeup of languages in the coming years, etc.
***
 How many languages (excluding English & French) are spoken as a first language in Canada?
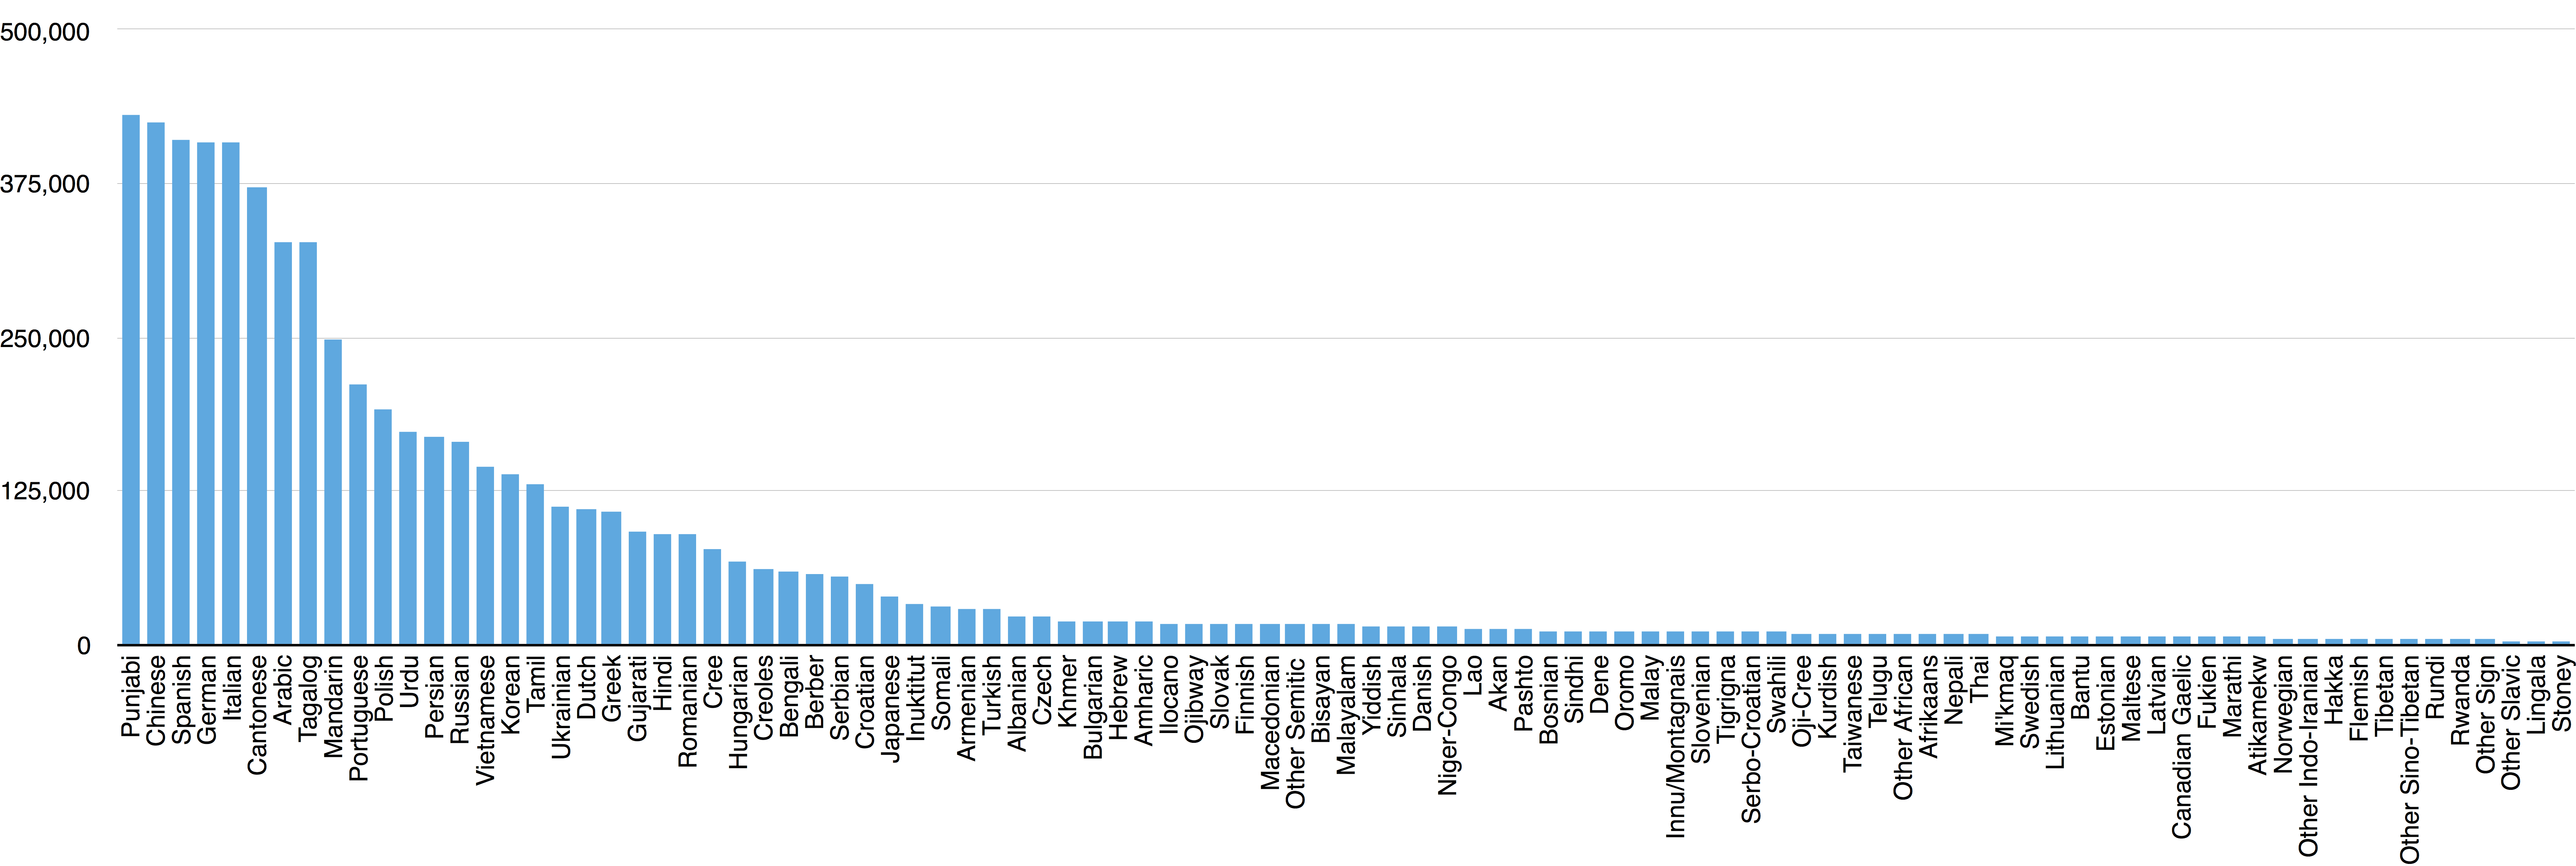
Over 200 languages are spoken as a first language in Canada, making it one of the most diverse countries on the planet.
No doubt 80% of Canadians speak either English or French. Aside from these two official languages, there’s a long tail of about 200 distinct languages spoken across Canada.
There are about 60 Aboriginal languages spoken in hundreds of pockets across Canada. In many cases their counts are not included in the census data tables. These languages have so few speakers and it would be impossible to publish the counts without violating their privacy.
Past English and French, the long tail is dominated by 20 first languages and the 5 million speakers who identify with it. We picked a cut-off of 100,000 speakers to list some of these foreign first languages.
| Rank | Language | Speakers |
|---|---|---|
| 1 | Punjabi | 430,705 |
| 2 | Chinese | 425,210 |
| 3 | Spanish | 410,670 |
| 4 | German | 409,200 |
| 5 | Italian | 407,485 |
| 6 | Cantonese | 372,460 |
| 7 | Arabic | 327,870 |
| 8 | Tagalog | 327,445 |
| 9 | Mandarin | 248,705 |
| 10 | Portuguese | 211,335 |
| 11 | Polish | 191,645 |
| 12 | Urdu | 172,800 |
| 13 | Persian | 170,045 |
| 14 | Russian | 164,330 |
| 15 | Vietnamese | 144,880 |
| 16 | Korean | 137,925 |
| 17 | Tamil | 131,265 |
| 18 | Ukrainian | 111,540 |
| 19 | Dutch | 110,490 |
| 20 | Greek | 108,925 |
***
 What age groups primarily speak English and French in Canada?
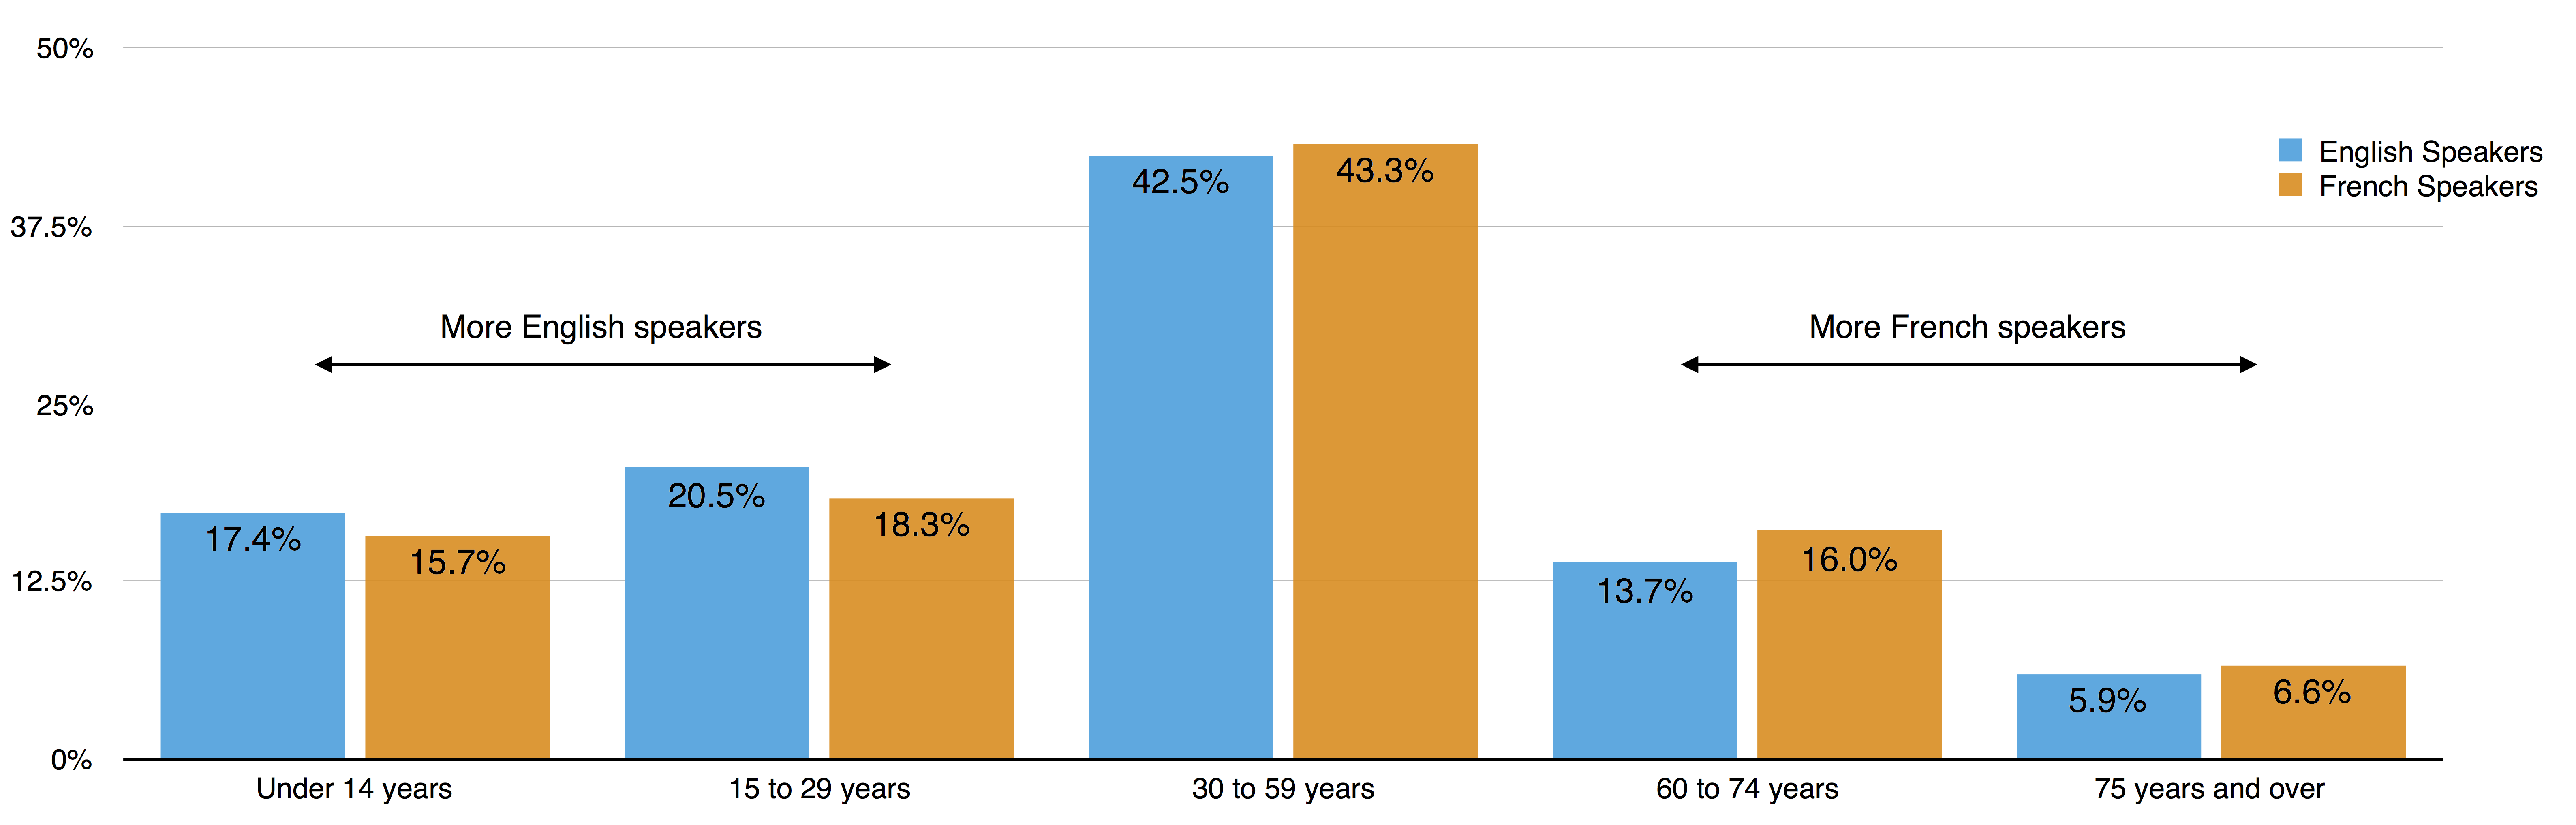
Young people are more likely to speak English than French.
The relationship between the French-speaking province of Quebec and Canada can be best described as “complicated.”
In principle, both English and French are official languages of Canada and 80% of the population speaking either attests to this.
But who is really speaking these languages?
Once again we turn to the census data to break down the English and French speakers by age demographics. Our software can automatically do this for us and it was the first question that came to mind as we explored the data.
Two insights we are able to glean from the age demographics of these speakers:
- Young people (under 29 years) are more likely to speak English than French
- Age groups 60 and above are more likely to speak French
In the last 70 years, the population of Canada has more than tripled, from 12 million in 1946 to an estimate of 35 million in 2016. Until the 1990s, the increase was due to natural increase (the net of number of births and deaths.) However, since the mid-1990s, the strong population growth is the result of immigration from other countries.
Age demographics are important because it greatly influences the economy: the number of workers contributing to economic productivity, savings rate that determines bank interest rates and particularly in the case of Canada, the impact to social welfare programs.
The aging French population is going to further test the Canada-Quebec relationship.
***
 What age groups primarily speak neither English and French in Canada?
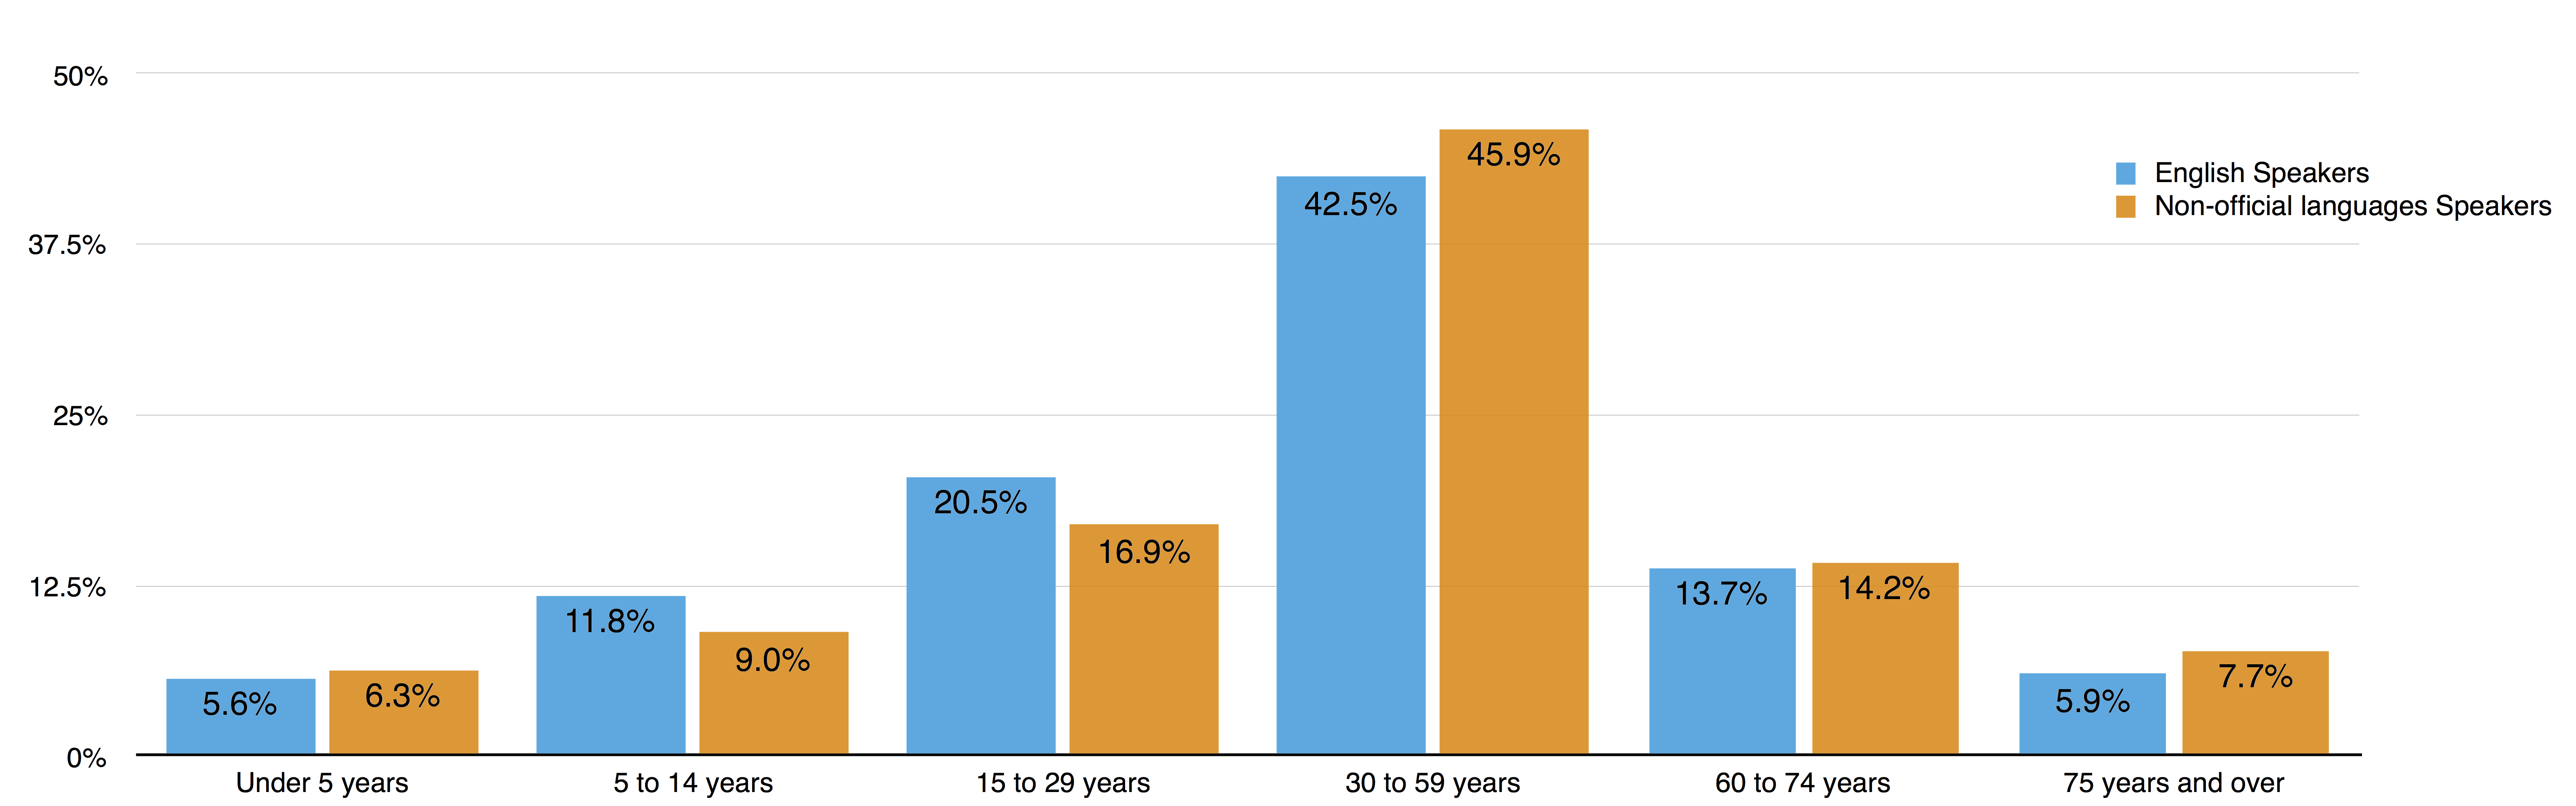
Children aren’t speaking English at home, but quickly do so when they start school.
French and English languages dominate the linguistic narrative in Canada. Our data analyst team believes it’s equally important to look at the non-official languages spoken in Canada.
So we got to work.
With the same age demographics analysis on the census dataset, we find non-official languages start out strong for children under the age of 5 years. That is to be expected as children first learn to speak whatever their parents speak at home.
After the children turns 5 years, the trend is reversed immediately and sharply.
Wow.
This is an important insight because the impact to early childhood educators cannot be understated. Not only are you teaching children to speak another language, but you are also training children to identify and think in another language.
Future curriculums for early childhood educators will need to take this changing age demographic into account.
***
Provinces are equally divided between official and non-official languages as the second dominant language.
| Official | Non-official | ||||
|---|---|---|---|---|---|
| Province | Total | English | French | Dominant language #1 | Dominant language #2 |
| British Columbia | 4,356,205 | 72.1% | 1.6% | Punjabi 4.5% | Cantonese 3.2% |
| Alberta | 3,610,180 | 78.7% | 2.2% | German 2.3% | Tagalog 1.9% |
| Manitoba | 1,193,095 | 74.9% | 4.0% | German 5.8% | Tagalog 3.4% |
| Saskatchewan | 1,018,310 | 85.7% | 1.9% | German 2.6% | Cree 2.4% |
| Northwest Territories | 41,040 | 77.7% | 2.8% | Tlicho 4.9% | Slavey 3.3% |
| Nunavut | 31,765 | 29.1% | 1.4% | Inuktitut 67.8% | Inuinnaqtun 0.9% |
| Official | Non-official | ||||
|---|---|---|---|---|---|
| Province | Total | English | French | Dominant language #1 | Dominant language #2 |
| Ontario | 12,722,065 | 70.4% | 4.4% | Italian 2.1% | Chinese 1.6% |
| Quebec | 7,815,955 | 9.0% | 79.7% | Arabic 2.1% | Spanish 1.8% |
| Nova Scotia | 910,620 | 92.5% | 3.8% | Arabic 0.7% | Mi’kmaq 0.5% |
| New Brunswick | 739,900 | 65.9% | 32.5% | Mi’kmaq 0.3% | German 0.3% |
| Newfoundland and Labrador | 509,950 | 97.8% | 0.6% | Innu/Montagnais 0.4% | Chinese 0.2% |
| Prince Edward Island | 138,435 | 92.7% | 4.1% | Chinese 0.9% | Dutch 0.4% |
| Yukon | 33,655 | 84.9% | 4.8% | German 2.6% | Tagalog 1.3% |
You often see non-official languages on signages and office store fronts getting a lot of foot traffic. Which is exactly the right attitude – serving and conversing with your constituents in their native languages goes a long way.
But are these social and political organizations taking a data-driven approach?
In addition to the age demographic breakdown, we were curious about provinces with a large groups of non-official language speakers.
Our data analysts once again turned to the census data and found languages like German in the provinces of Alberta and Manitoba have far more speakers than French. Our data analysis software allows us to further drill down each province into its regional districts – making hyper targeted campaigns based on demographics possible.
***
Immigrants who don’t speak English or French go to the prairies.
The three biggest provinces for immigration by absolute numbers are Ontario, Quebec and British Columbia. Over the last 20 years, year after year, 60% of the immigrants have consistently landed in one of these three provinces.
Who then goes to the other provinces?
As we alluded to earlier in this article, most of the population growth is the result of immigration from other countries. Our data analysts suggested we look at the population growth of official and non-official languages in each province. Fortunately, the census data provides such a break down.
| Rank | Province | % change (2006 to 2011) of non-official language speakers |
|---|---|---|
| 1 | Saskatchewan | 65.2% |
| 2 | Manitoba | 34.7% |
| 3 | Alberta | 22.6% |
| Rank | Province | % change (2006 to 2011) of non-official language speakers |
|---|---|---|
| 1 | British Columbia | 17.2% |
| 2 | Ontario | 12.1% |
| 3 | Quebec | 8.3% |
The data clearly shows the growth rates of non-official speakers in Saskatchewan, Manitoba and Alberta far surpass the growth rates of the other three big immigration provinces. It’s difficult to explain this phenomena without some background on Canadian immigration.
The federal government publishes guidelines for incoming immigrants along various classes:
- economic immigrants who are people selected for their skills and ability to contribute to Canada’s economy, usually skilled workers and business people
- “family class” immigrants who are sponsored by closely related persons of Canadian residents living in Canada
- refugees
Economic immigrants are by far the biggest class of immigrants coming to Canada. Economic immigrants have a higher threshold for knowledge of the official languages, but it’s left to the province to decide what that threshold is.
Simply put, provinces like Manitoba and Saskatchewan are not attracting migration from other provinces and are facing a skilled labor shortfall. The only way to fulfill that labor shortfall is via immigration.
In fact, provinces like Saskatchewan have a list of occupations in demand, many of which do not require knowledge of the official languages in order to qualify for immigration.
There’s a lot of interest in immigrating to Canada. If a person doesn’t know one of the official languages, the only way for them to qualify for immigration is to land up in the prairies.
***
Highlights & Conclusions
- There are more than two hundred languages spoken across Canada. Twenty of them besides English and French have a reported hundred thousand speakers each.
- Young people are increasing speaking more English than French. Since the mid-1990s, population growth in Canada is through immigration. The value of learning French needs more reinforcing across Canada.
- Children are more likely to speak an immigrant language at home growing up. This poses challenges to early childhood educators who are teaching these children to speak and think in one of the official languages.
- Each province shows a distinct immigrant language as the second most spoken one. For example, Punjabi in British Columbia and Tagalog in Manitoba are on the rise.
- Saskatchewan, Manitoba and Alberta attract immigrants who have no knowledge of the official languages because of special lower language requirements to qualify for immigration.