With the tax season on the horizon, money, deductions and refunds are on everyone’s minds. As data -eating, -sleeping and -talking people we were compelled to show our fellow Canadians what their neighbors were doing (but not in a creepy way!) We pored over the Canadian open data portal and found the perfect data set – extensive, aggregated year over year TFSA data.
But … What could we possibly show with this data?
We didn’t want to write another financial advice article.
We didn’t want to write another article touting the pros and cons of the TFSA program.
We didn’t want to stir the government -vs- the people debate any further.
Just the data, Ma’am.
We faithfully tried to discover novel and interesting facts about Canadians and their savings patterns, alas it was not meant to be. Read on further for the full story.
***
Hold on, introduce me to the Tax-Free Savings Account (TFSA) program.
The TFSA, introduced in 2009 is an account in which Canadian residents 18 years and older can save or invest. Income earned on contributions is not taxed. The TFSA account-holder may withdraw money from the account at any time, free of taxes.
As of January 1, 2017, the total cumulative contribution room for a TFSA is $52,000 for those who have been 18 years or older and residents of Canada for all eligible years.
| Year | Contribution Room Added | Cumulative Contribution Room |
|---|---|---|
| 2009 | $5,000 | ↓ |
| 2010 | $5,000 | ↓ |
| 2011 | $5,000 | ↓ |
| 2012 | $5,000 | ↓ |
| 2013 | $5,500 | ↓ |
| 2014 | $5,500 | ↓ |
| 2015 | $10,000 | ↓ |
| 2016 | $5,500 | ↓ |
| 2017 | $5,500 | $52,000 |
The contribution room accumulated grows indefinitely, regardless of age group, income level or province. The dollar amounts are pegged to inflation rates, except for that one year in 2015 with a $10,000 contribution. As long as you’re above 18 years or older and a resident of Canada, you can contribute.
When the TFSA was introduced in 2009, Canadians loved them. Your money could grow fast and there were no penalties for withdrawals.
***
The government has open data on you – the savers participating in the TFSA.
The Canadian Revenue Agency gives us data on how we participate in the TFSA, how many of us maxed out our contribution room, and how many savings accounts we opened / closed in the year. They give us six years of data, since the program was instituted in 2009.
They break down these statistics by age groups, income classes and by provinces. They also give us fair market value of each individual’s holding which can be used to benchmark how Canadians are investing within their TFSAs.
Fear not, all data given to us is aggregated and anonymized. There are no privacy issues that can identify a single individual.
For the purposes of succinctness, we limit our data analysis to people who maxed out their contribution room. Otherwise we’ll include people who contribute $1.00 to their account and the analysis won’t be meaningful.
Without further ado, the (troubled) story of data investigation and discovery starts now.
***
 What age groups primarily max out their TFSA contributions?
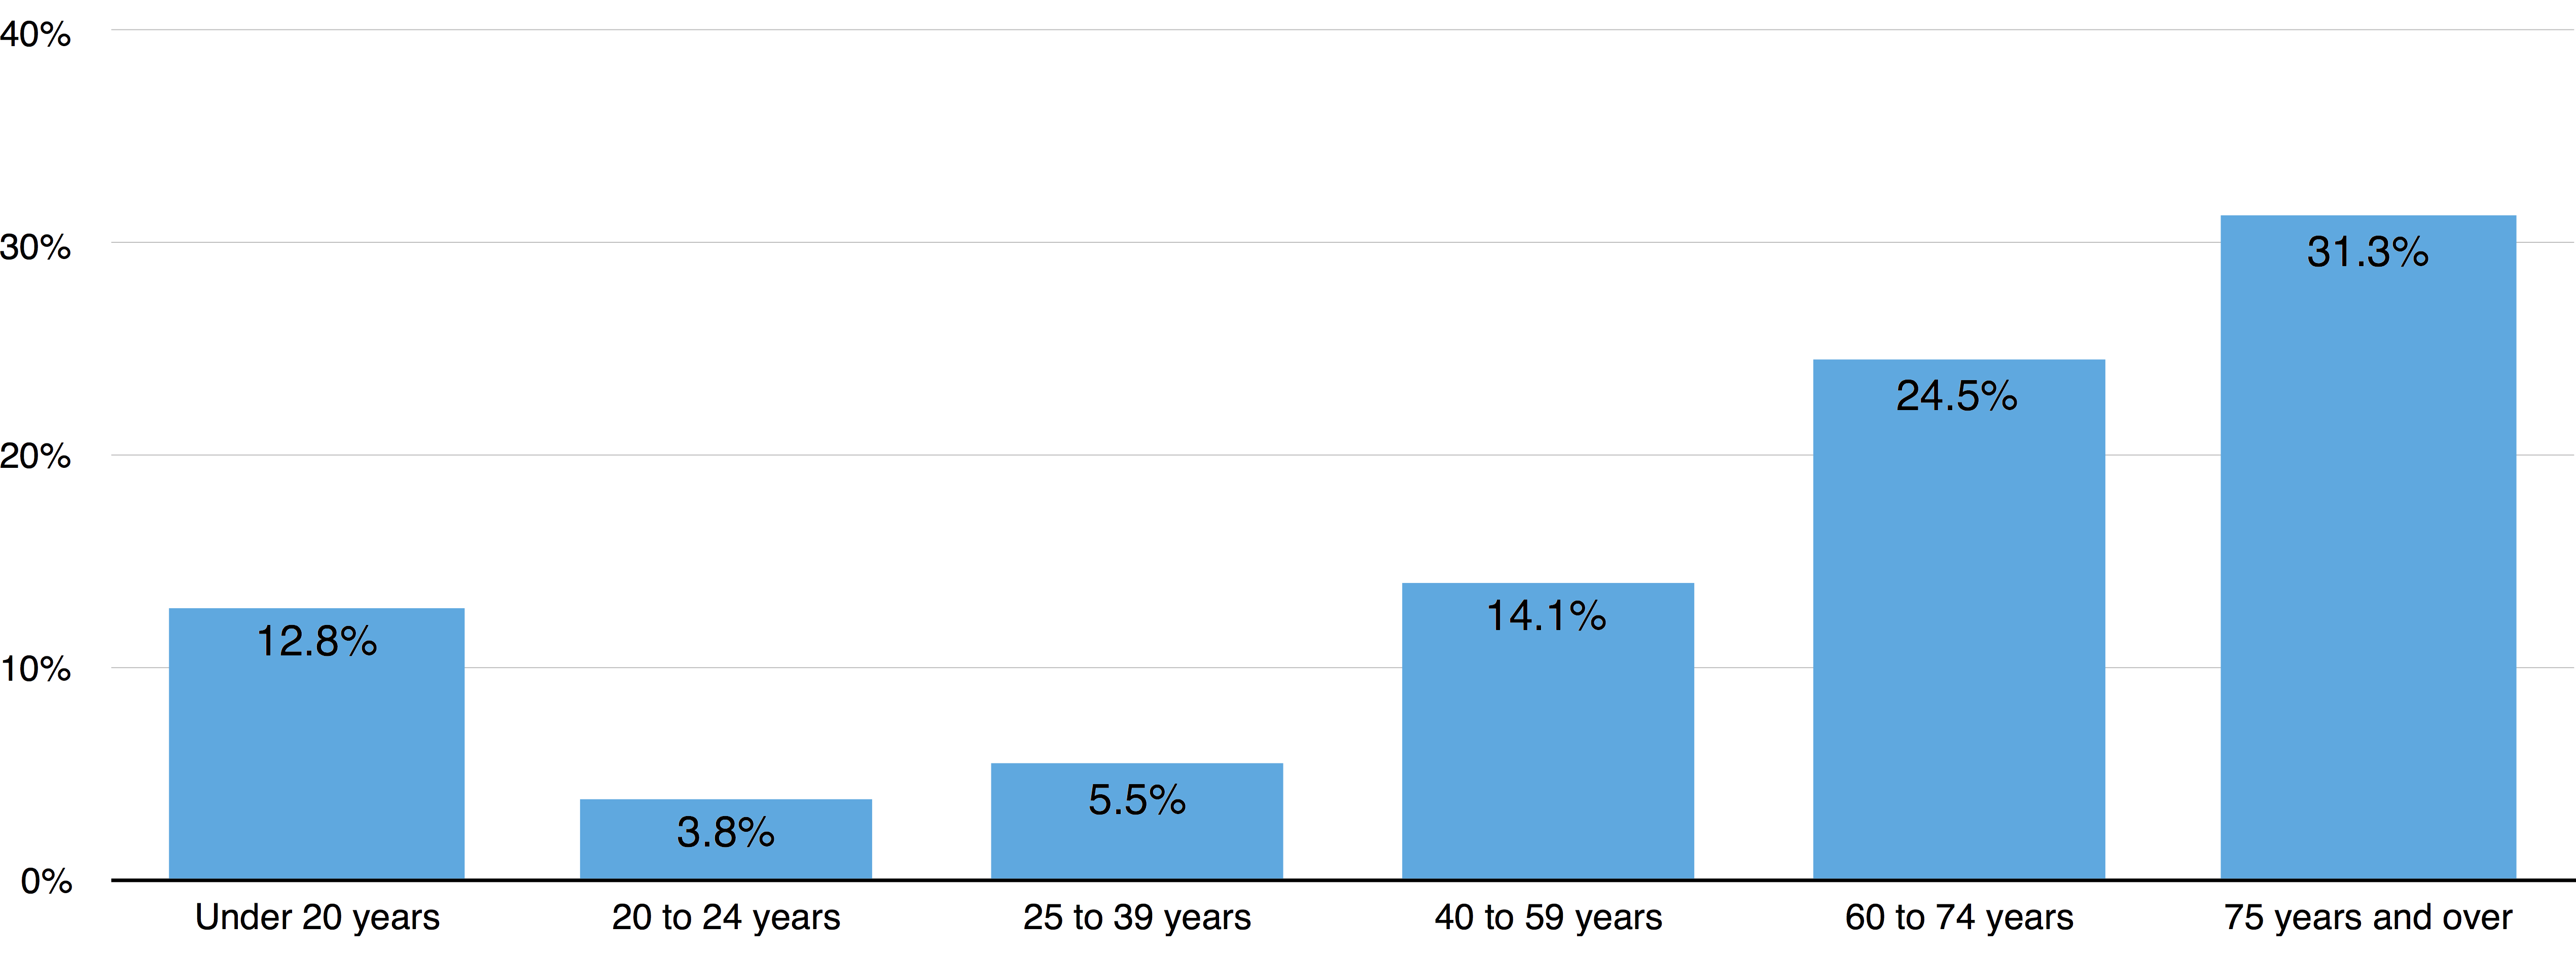
Older Canadians max out their TFSA contribution room each year more than younger Canadians.
The first set of questions to ask are about Canadians and their saving patterns across age groups. The data shows that Canadians the age of 40 years and over are increasingly maxing out their contribution room.
Is there anything surprising or novel about this insight?
No, not really.
Young people earn less at the start of their career and in general have less free cash at the end of the year to put towards savings. They have different priorities like paying off their mortgage, their college debts and possibly investing towards their kids college funds.
At the tail end of the age group – 75 years and over – it makes sense to stash your extra cash flow into a TFSA. You can take your money out at any time for an emergency without a penalty.
Story so far: There isn’t anything novel about what age groups are maxing out their contribution room. Let’s not report these results to the client.
***
 What income groups primarily max out their TFSA contributions?
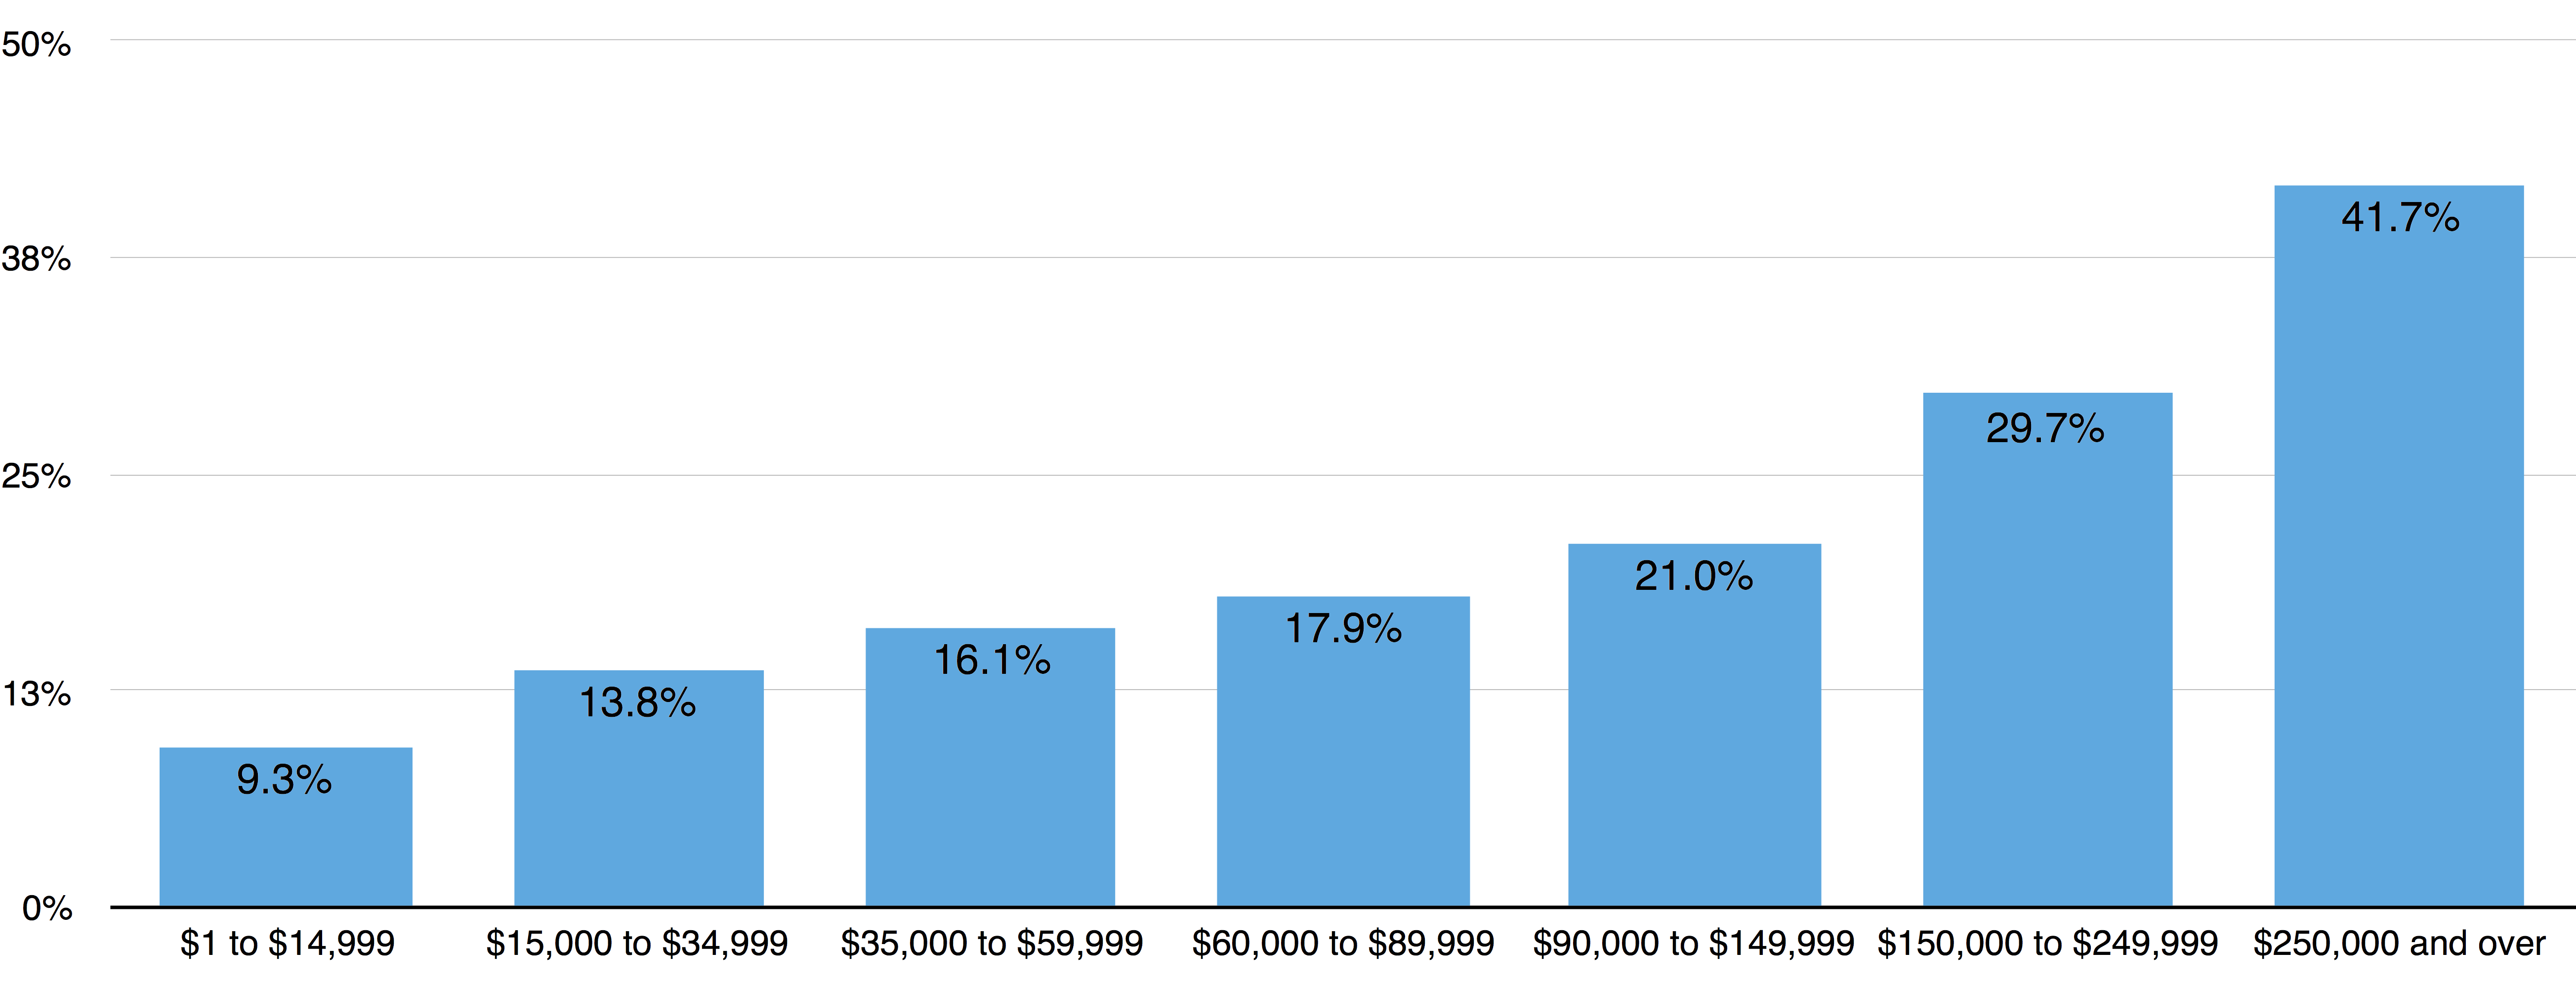
Canadians with more income max out their TFSA contribution room each year more that those who earn less.
Canadians in high income groups have more money at the end of the year to put towards savings, you say?
A linear trend of higher income groups saving and investing more is not interesting at all. If anything, that’ll just fuel the “rich are getting richer” narrative that is so often spoken about – not saying it’s true or false, just that argument is not in the scope of this investigation.
Another dead end – an analysis by income groups wasn’t going to show anything novel.
That said … we promised to stick to the data and just the data. But this observation is too important to pass up.
Consider the case for a family of four (kids 18+) that is able to consistently max out their contribution room year after year. If the contribution room is $5,000 per person per year (as an example) then in 10 years, the family will have $200,000 of principal stored up. All income earned on that $200,000 is tax-free in perpetuity.
The tax-free income is important because of the magic of compounding. That $200,000 now has a market value of $264,135.
The government is not going to see a single cent from that $264,135. That’s a lot of tax revenue escaping the government. Like everyone else, I like free money too, but not at the risk of bankrupting our country.
Story so far: Our second unfruitful analysis. Let’s not report these results to the client.
***
Saskatchewanians & British Columbians are able to max out their TFSA contribution room each year more than other provinces across Canada.
| Rank | Province | % of account holders who are contributing their max |
|---|---|---|
| 1 | Saskatchewan | 17.8% |
| 2 | British Columbia | 17.3% |
| 3 | Manitoba | 16.2% |
| 4 | Prince Edward Island | 15.3% |
| 5 | Ontario | 15.3% |
| 6 | Quebec | 15.2% |
| 7 | Alberta | 15.0% |
| 8 | Newfoundland and Labrador | 14.2% |
| 9 | New Brunswick | 14.0% |
| 10 | Nova Scotia | 13.7% |
| 11 | Yukon | 12.9% |
| 12 | Northwest Territories | 8.3% |
| 13 | Nunavut | 5.4% |
No single province particularly stands out here – the differences between the provinces are within error thresholds.
British Columbians save a lot more because housing is a major concern and it’s likely people are saving up for a down payment. The flexibility of TFSA really shines here.
Saskatchewan and Manitoba are magnets for immigrants and in general immigrants save more.
The territories of Yukon, Nunavut and Northwest Territories show a deviation from the rest of the provinces. Our belief is that people in those areas are not fully aware of the available options to save money, though we have no data to back up that claim.
Story so far: There is no big difference between how each province saves. Three investigations so far with nothing to show – our exhaustion was starting to set in. But we have a job to do – let’s plow on.
***
Canadians are participating less in the TFSA program over time.
Our next analysis was that of adoption rates over time. Are TFSA account holders participating more or less in the program over time?
Intuitively, I know most of my peers scaled down or completely stopped maxing out their TFSA contribution room. The increase to $10,000 in 2015 made it even harder – this is post-tax income we are talking about. Who has that kind of money? We were having trouble maxing out our RRSPs as it is.
Let’s see what the data shows us.
| Year | % change of account holders who are contributing at all | % change of account holders who are contributing their max |
|---|---|---|
| 2009 | – | – |
| 2010 | -19% | -24% |
| 2011 | -4% | -10% |
| 2012 | -6% | -7% |
| 2013 | -1% | -5% |
| 2014 | -1% | -2% |
The data shows us a consistent year-over-year drop in both account holders who are contributing at all and account holders who are maximizing their contribution room.
Why might that be?
Any new program goes through the initial excitement of novelty before the novelty drops off. With time, you’ll have growth from new people eligible to join the program (as Canadians turn 18) balancing the loss of account holders either through death or being disillusioned with the program. A steady state is bound to happen. That’s exactly what we are seeing in the years 2013-2014 as the percentage changes are stabilizing.
Story so far: The adoption rates dropping are definitely interesting and worth investigating further. But we can’t present a single insight to the client can we?
***
Highlights & Conclusions. Almost.
It was time to admit to ourselves and the client that we had failed.
Our data analysts did the best work humanly possible with the available data, but after FOUR thorough investigations we came up empty. I was feeling disappointed. I so badly wanted to share some novel insights in the data, but no dice.
Should we Canadians scrap the program? In 2014, just 15% of Canadians who hold TFSAs maxed out their contribution room. It’s mostly used by higher-income, older Canadians – those that least need the financial help. The rest are either not seeing the value of saving or are simply unable to save.
A good way to understand these macroeconomic questions is in terms of supply and demand. If we see a decrease in the demand for the TFSA, then the follow up question we need to ask is what substitute / complementary program is showing a corresponding increase. We only showed that there’s a decrease, but never answered WHY this was the case.
If the Canadian Revenue Agency were to open up another dataset, perhaps the RRSP contribution data, then maybe we can resolve this unsettled question. Now that would complete the analysis!